Production reports
The production reports show what has been made: by day across a week, by station, by work order and by SKU. Production Entries lists every single entry of production that Busroot recorded.
All the reports are in the Production menu. Each one can be downloaded as CSV.
Weekly Report
Open Production > Weekly Report and choose the week.
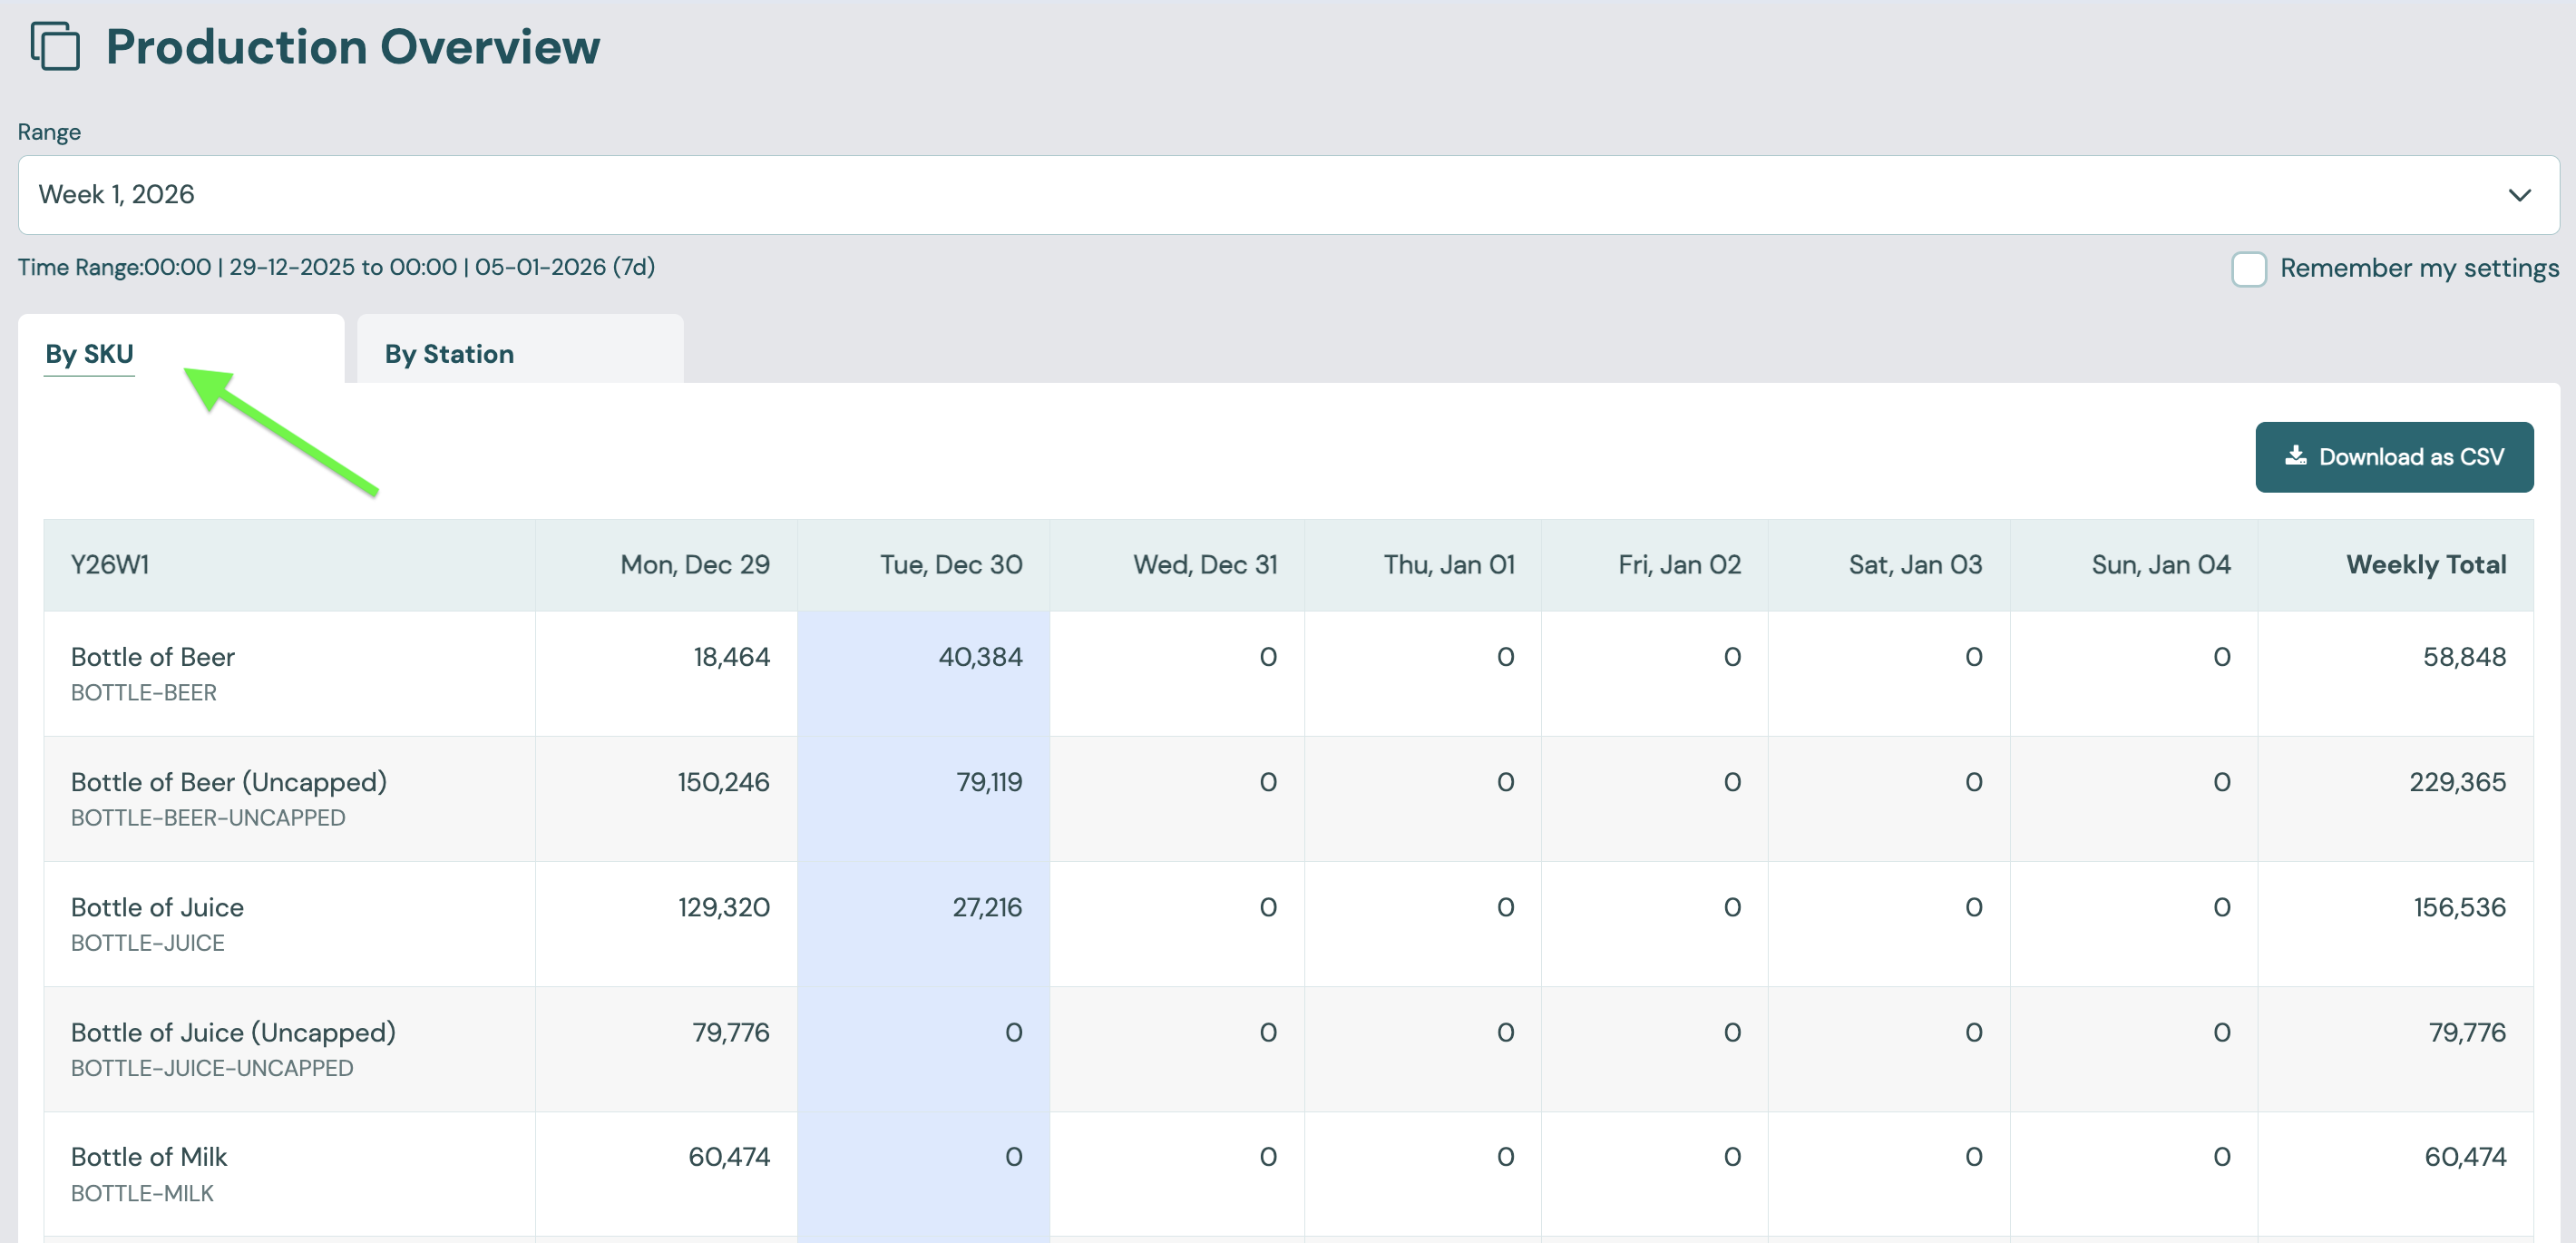
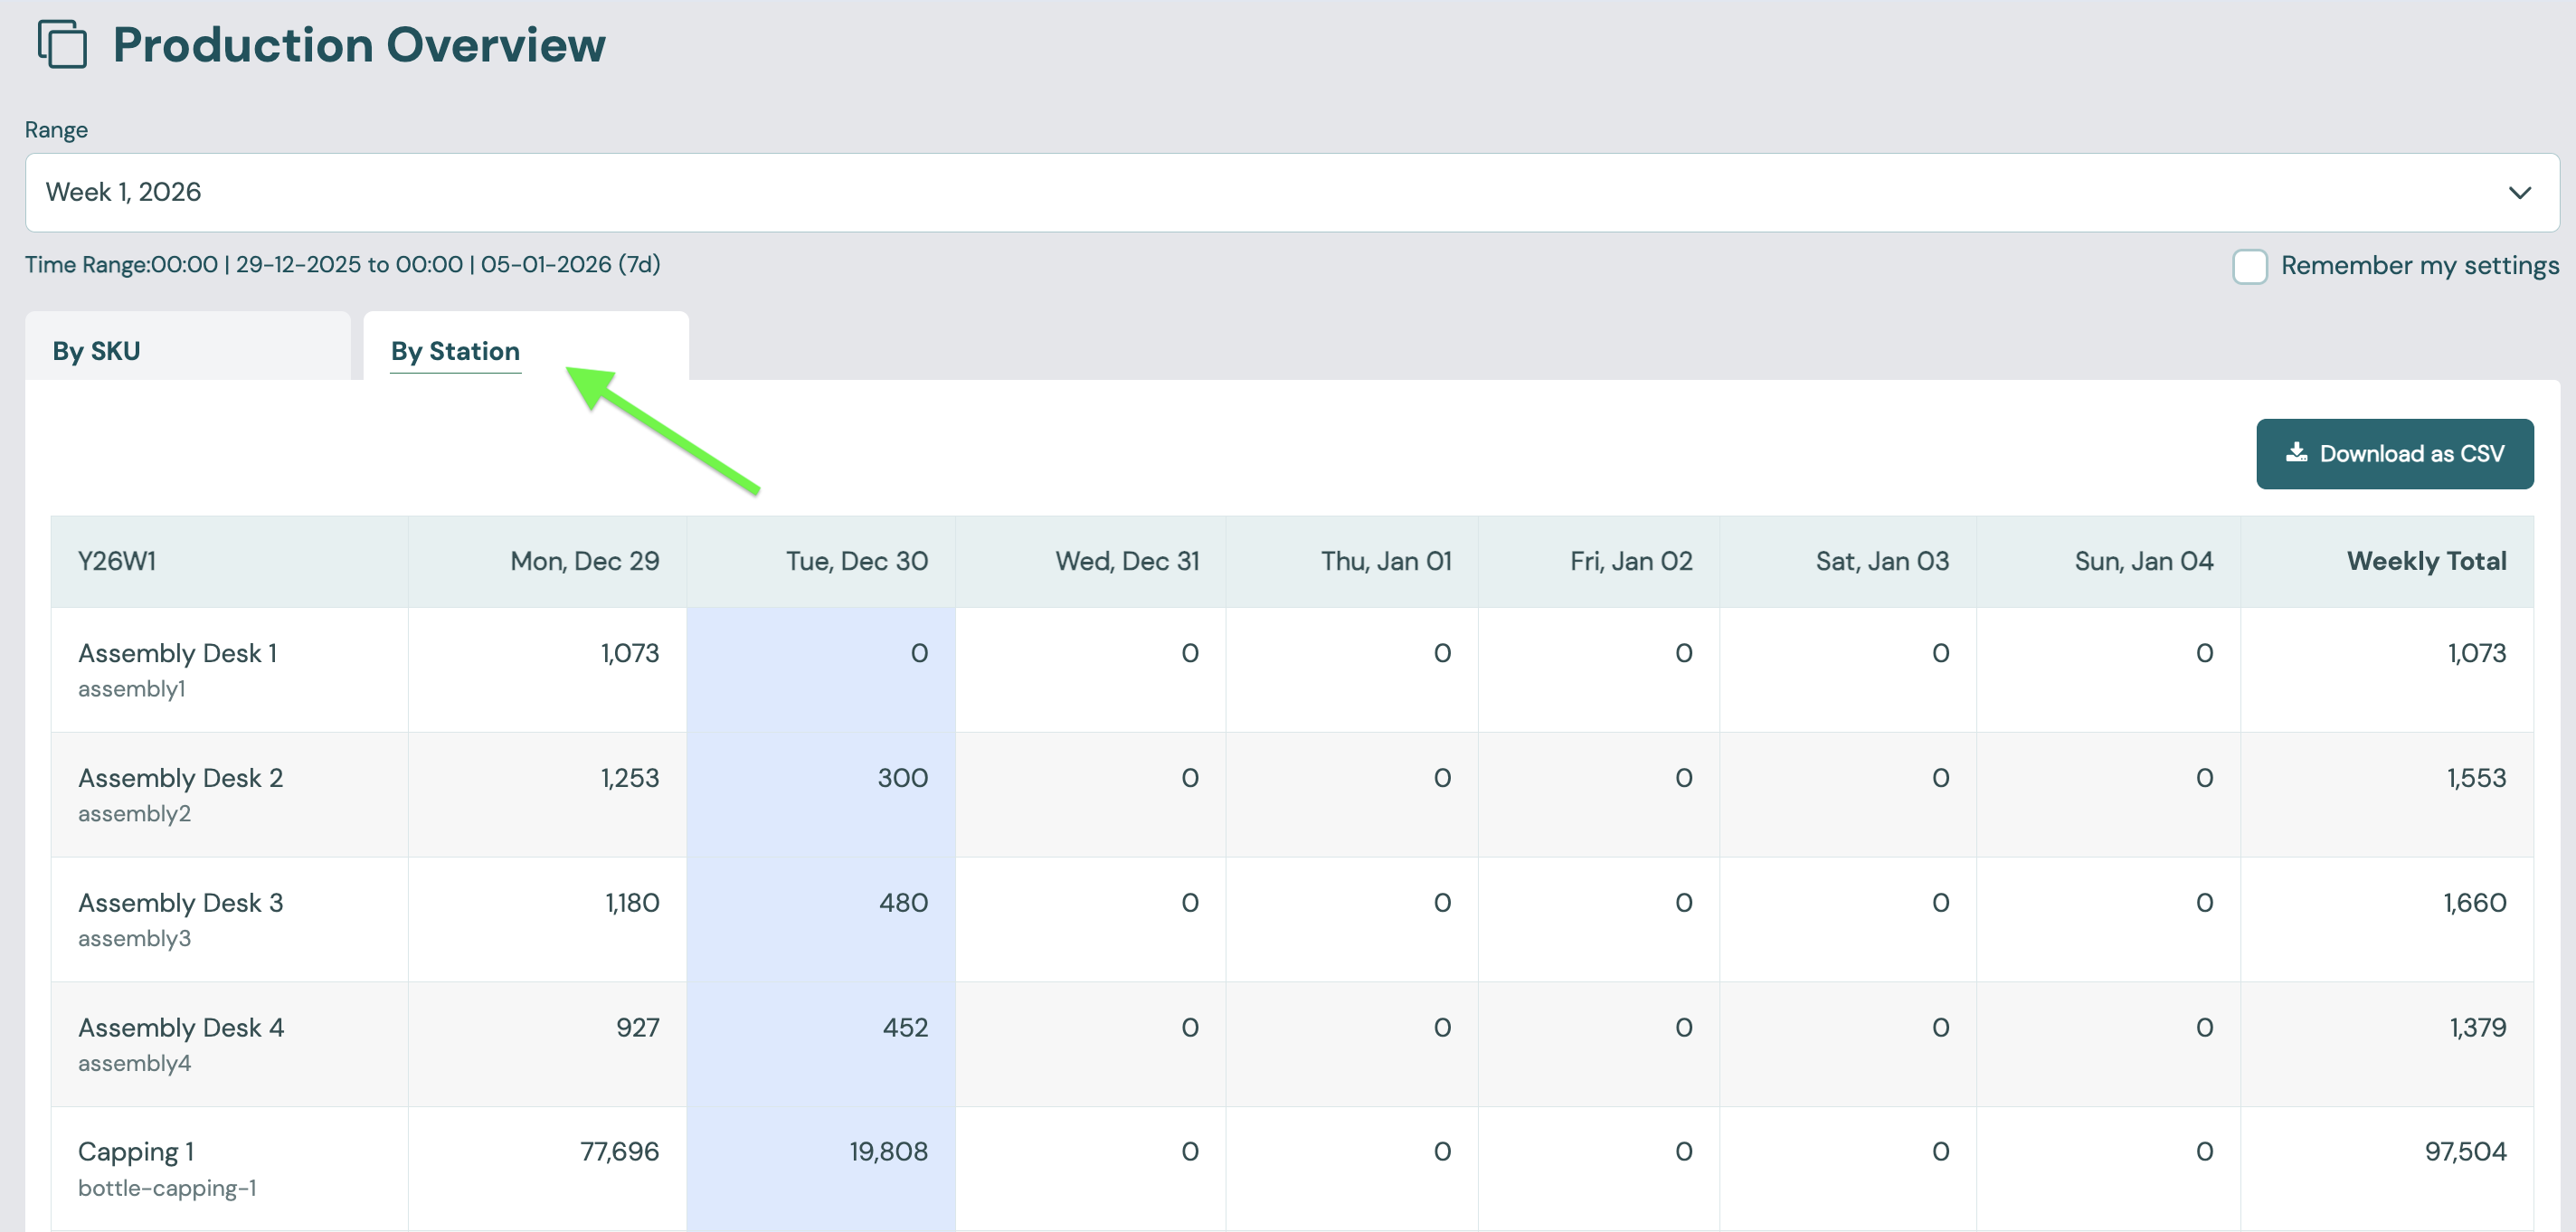
The Weekly Report shows one production week, with a column for each day and a Weekly Total. It has two tabs:
- By SKU: the quantity of each SKU produced on each day.
- By Station: the quantity produced on each station on each day.
Each tab has its own CSV download. The week follows your account's week start day and day start hour.
Note
The two tabs, and the two CSV downloads, are calculated from different stores of production data. Their totals can differ slightly.
by Station
Open Production > by Station.
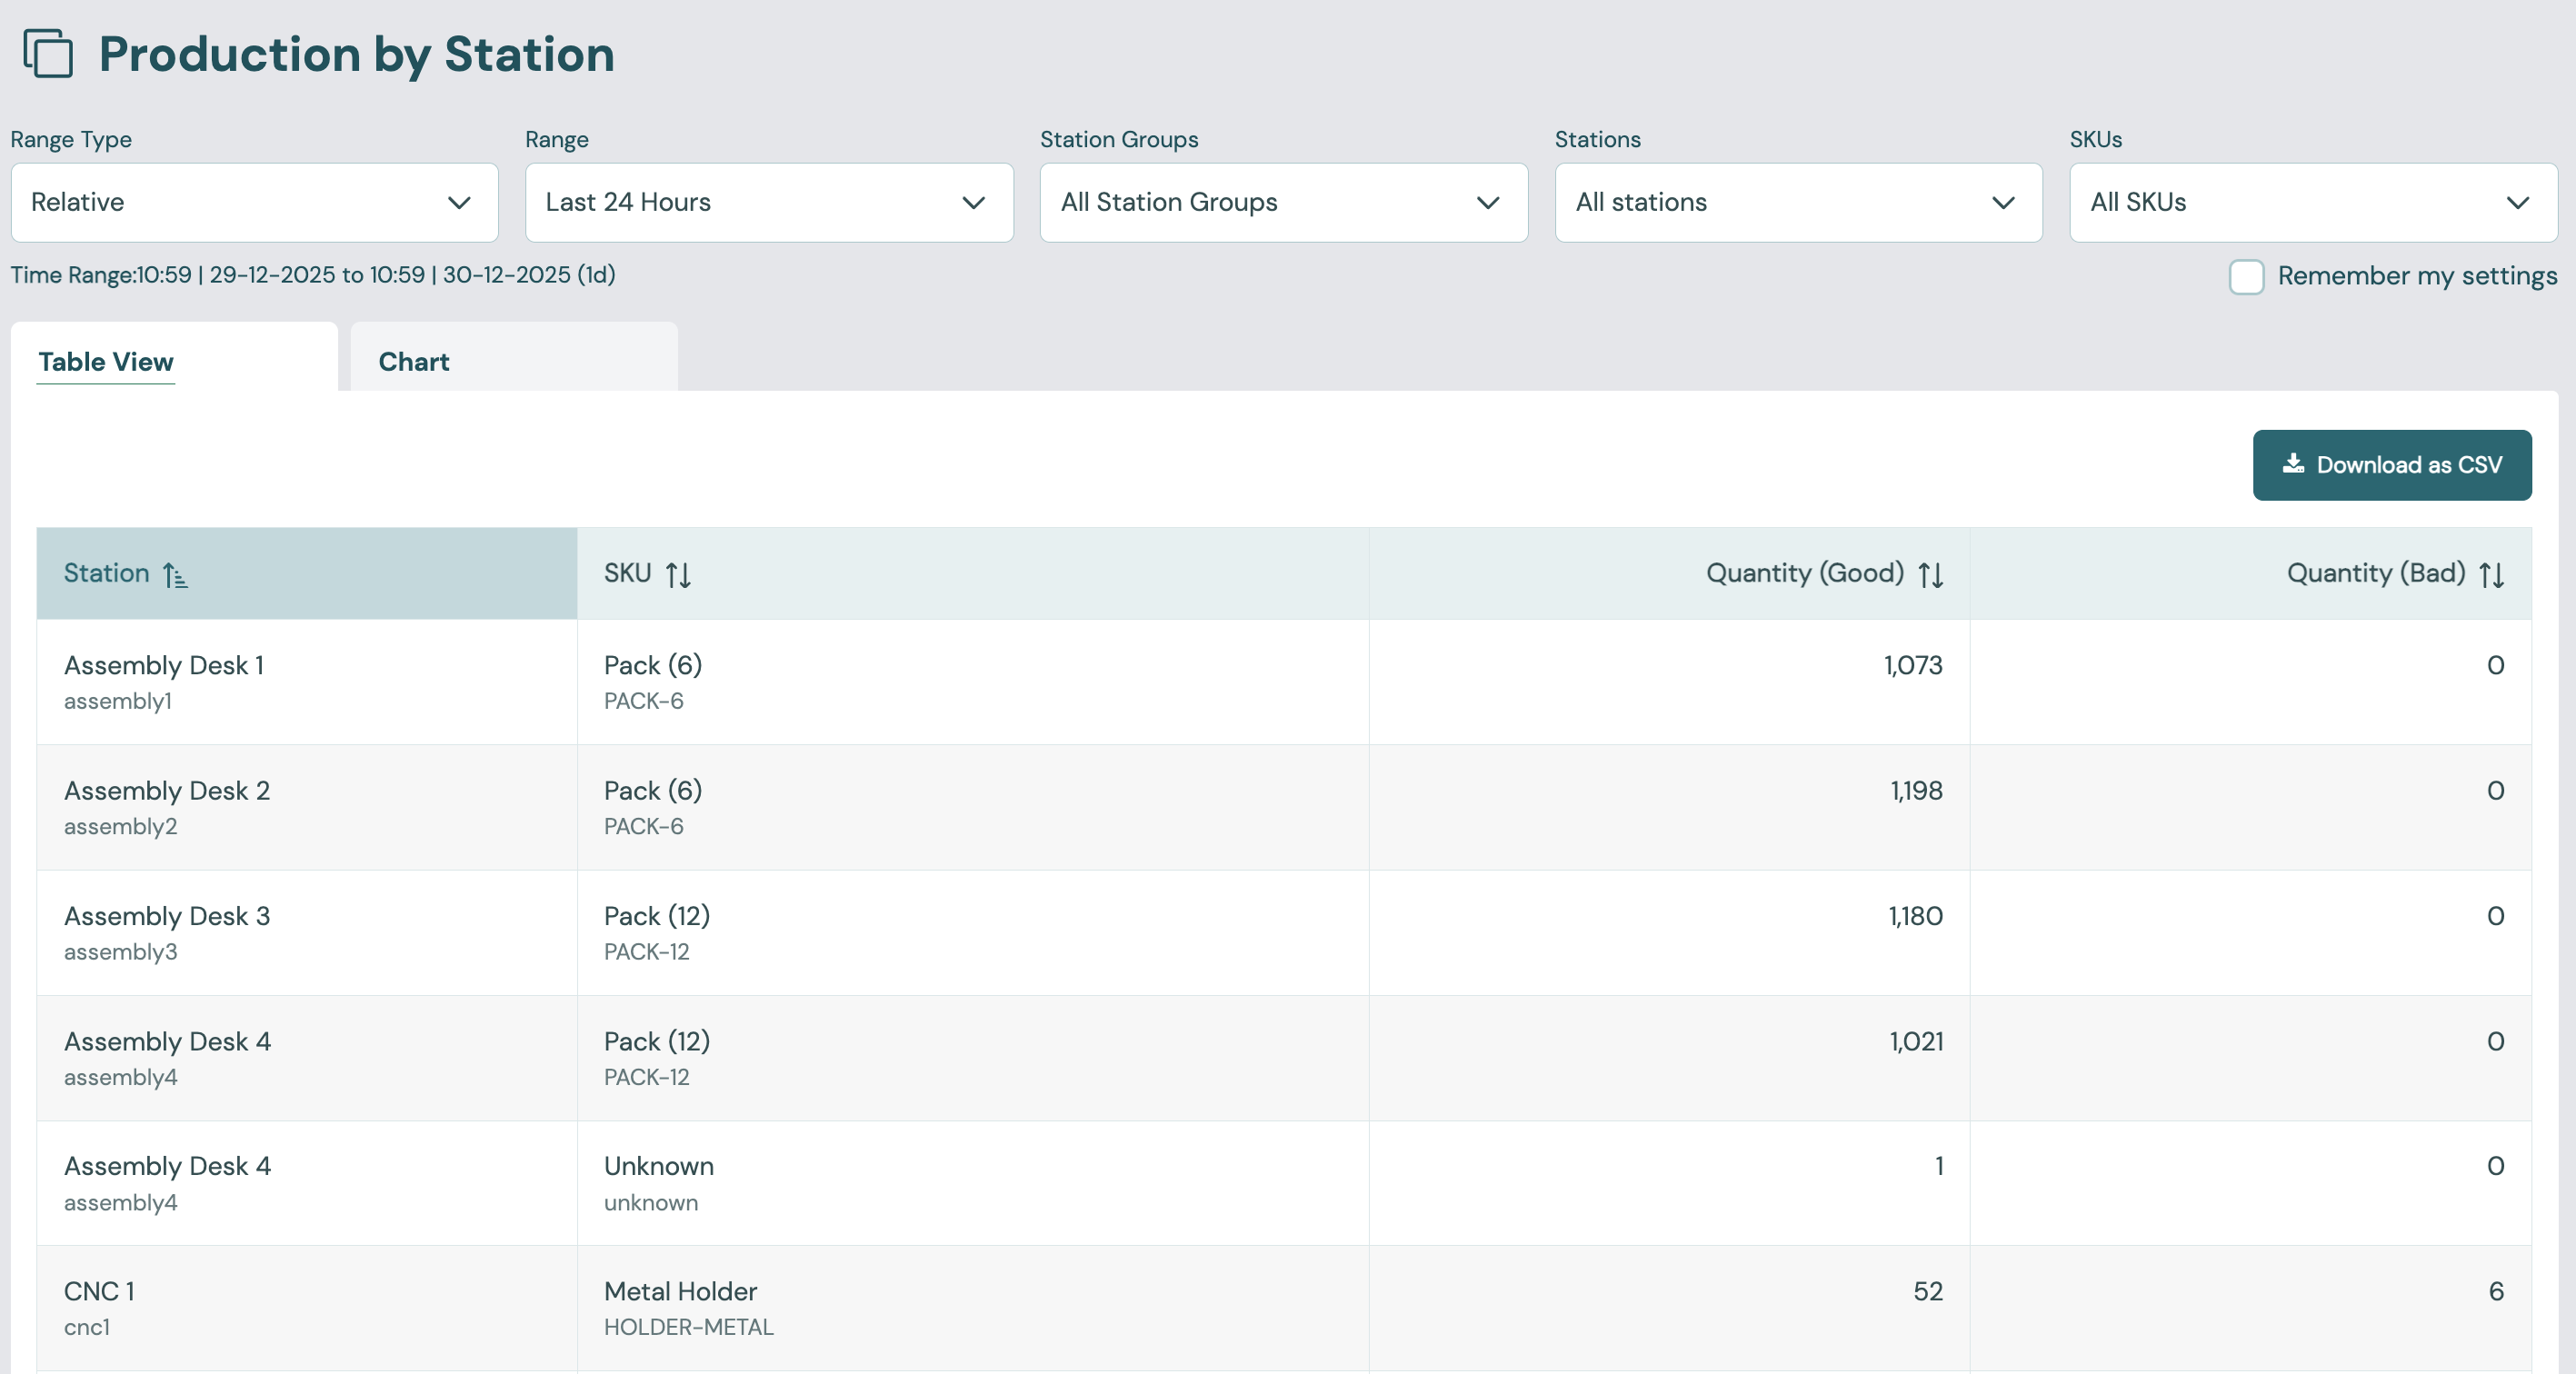
This report shows the volume of each SKU produced on each station, as Quantity (Good) and Quantity (Bad). You can filter by station and SKU, and choose a day, week, month, quarter, relative range (up to the last 6 months) or custom range. The Chart tab shows the same data as a bar chart.
by WO Ref.
Open Production > by WO Ref.
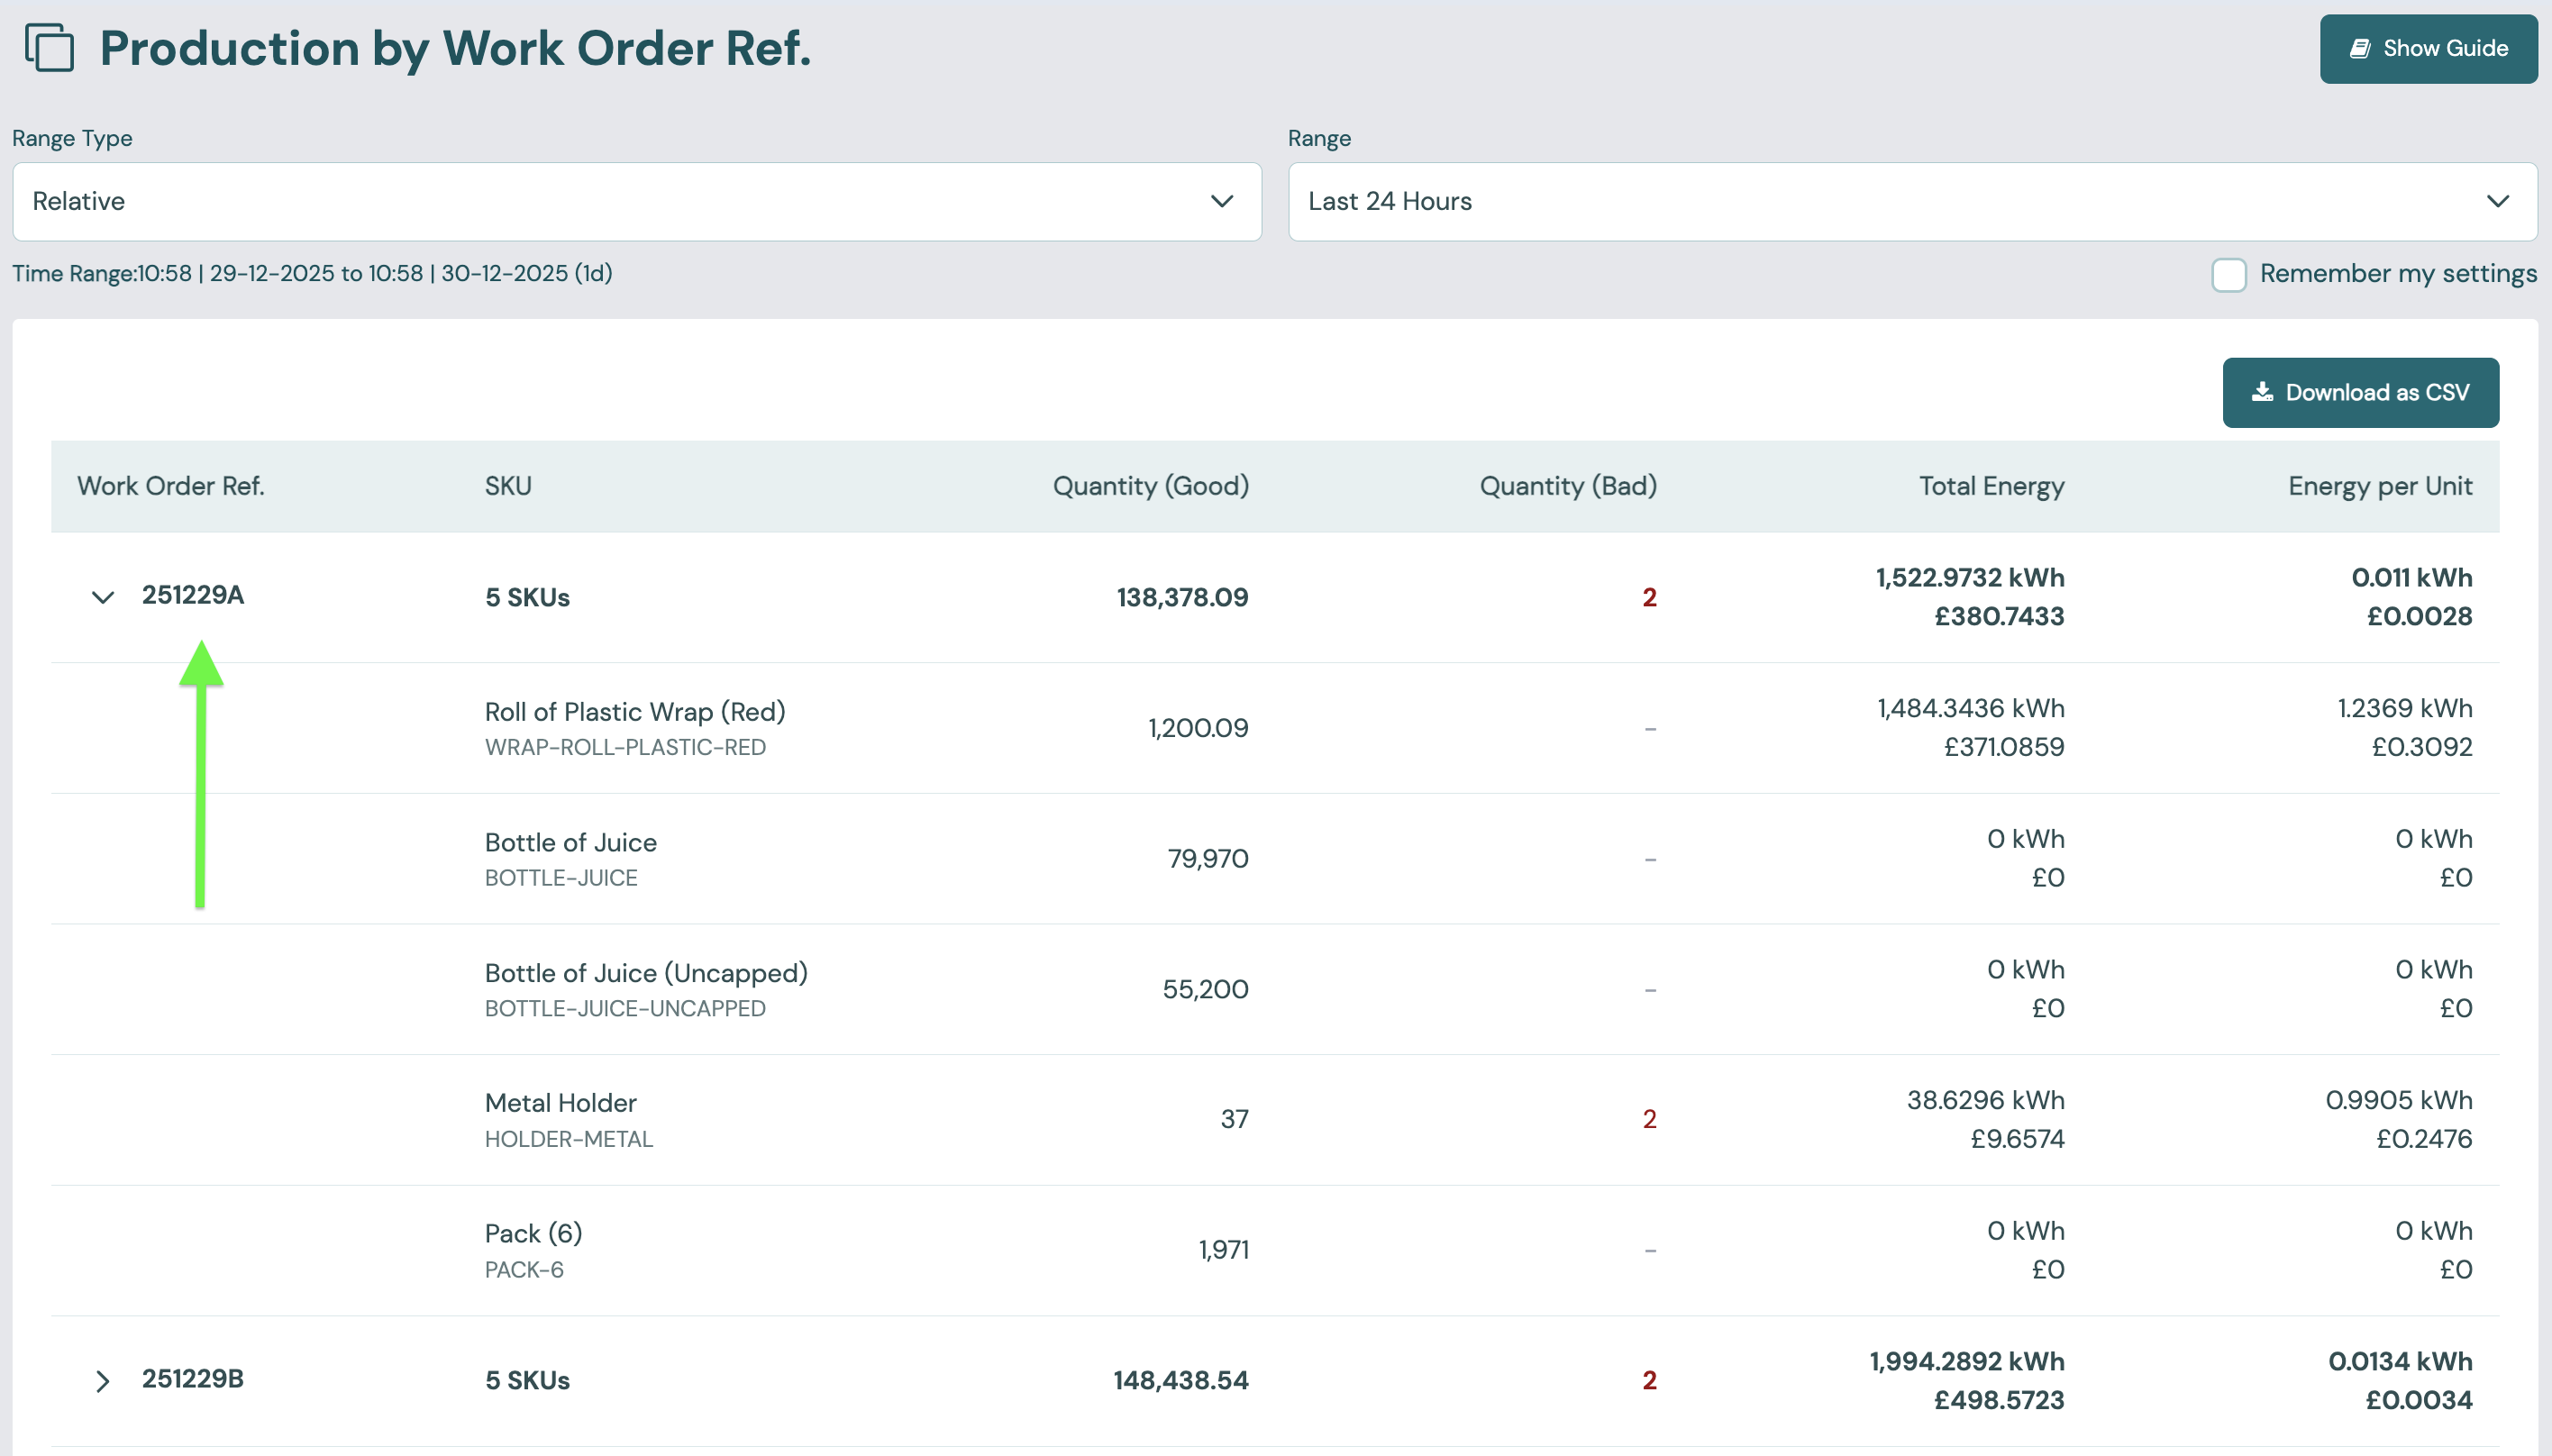
This report shows production grouped by work order reference, then by SKU. For each work order it shows the SKUs made, Quantity (Good) and Quantity (Bad). Work order references are set on production schedules. See Gantt & Schedules.
If you measure energy, the report also shows Total Energy and Energy per Unit for each work order and SKU. A work order can combine several schedules. When lost production cost is turned on, the energy values are also shown in £. See Energy consumed and Energy per unit.
by SKU
Open Production > by SKU.
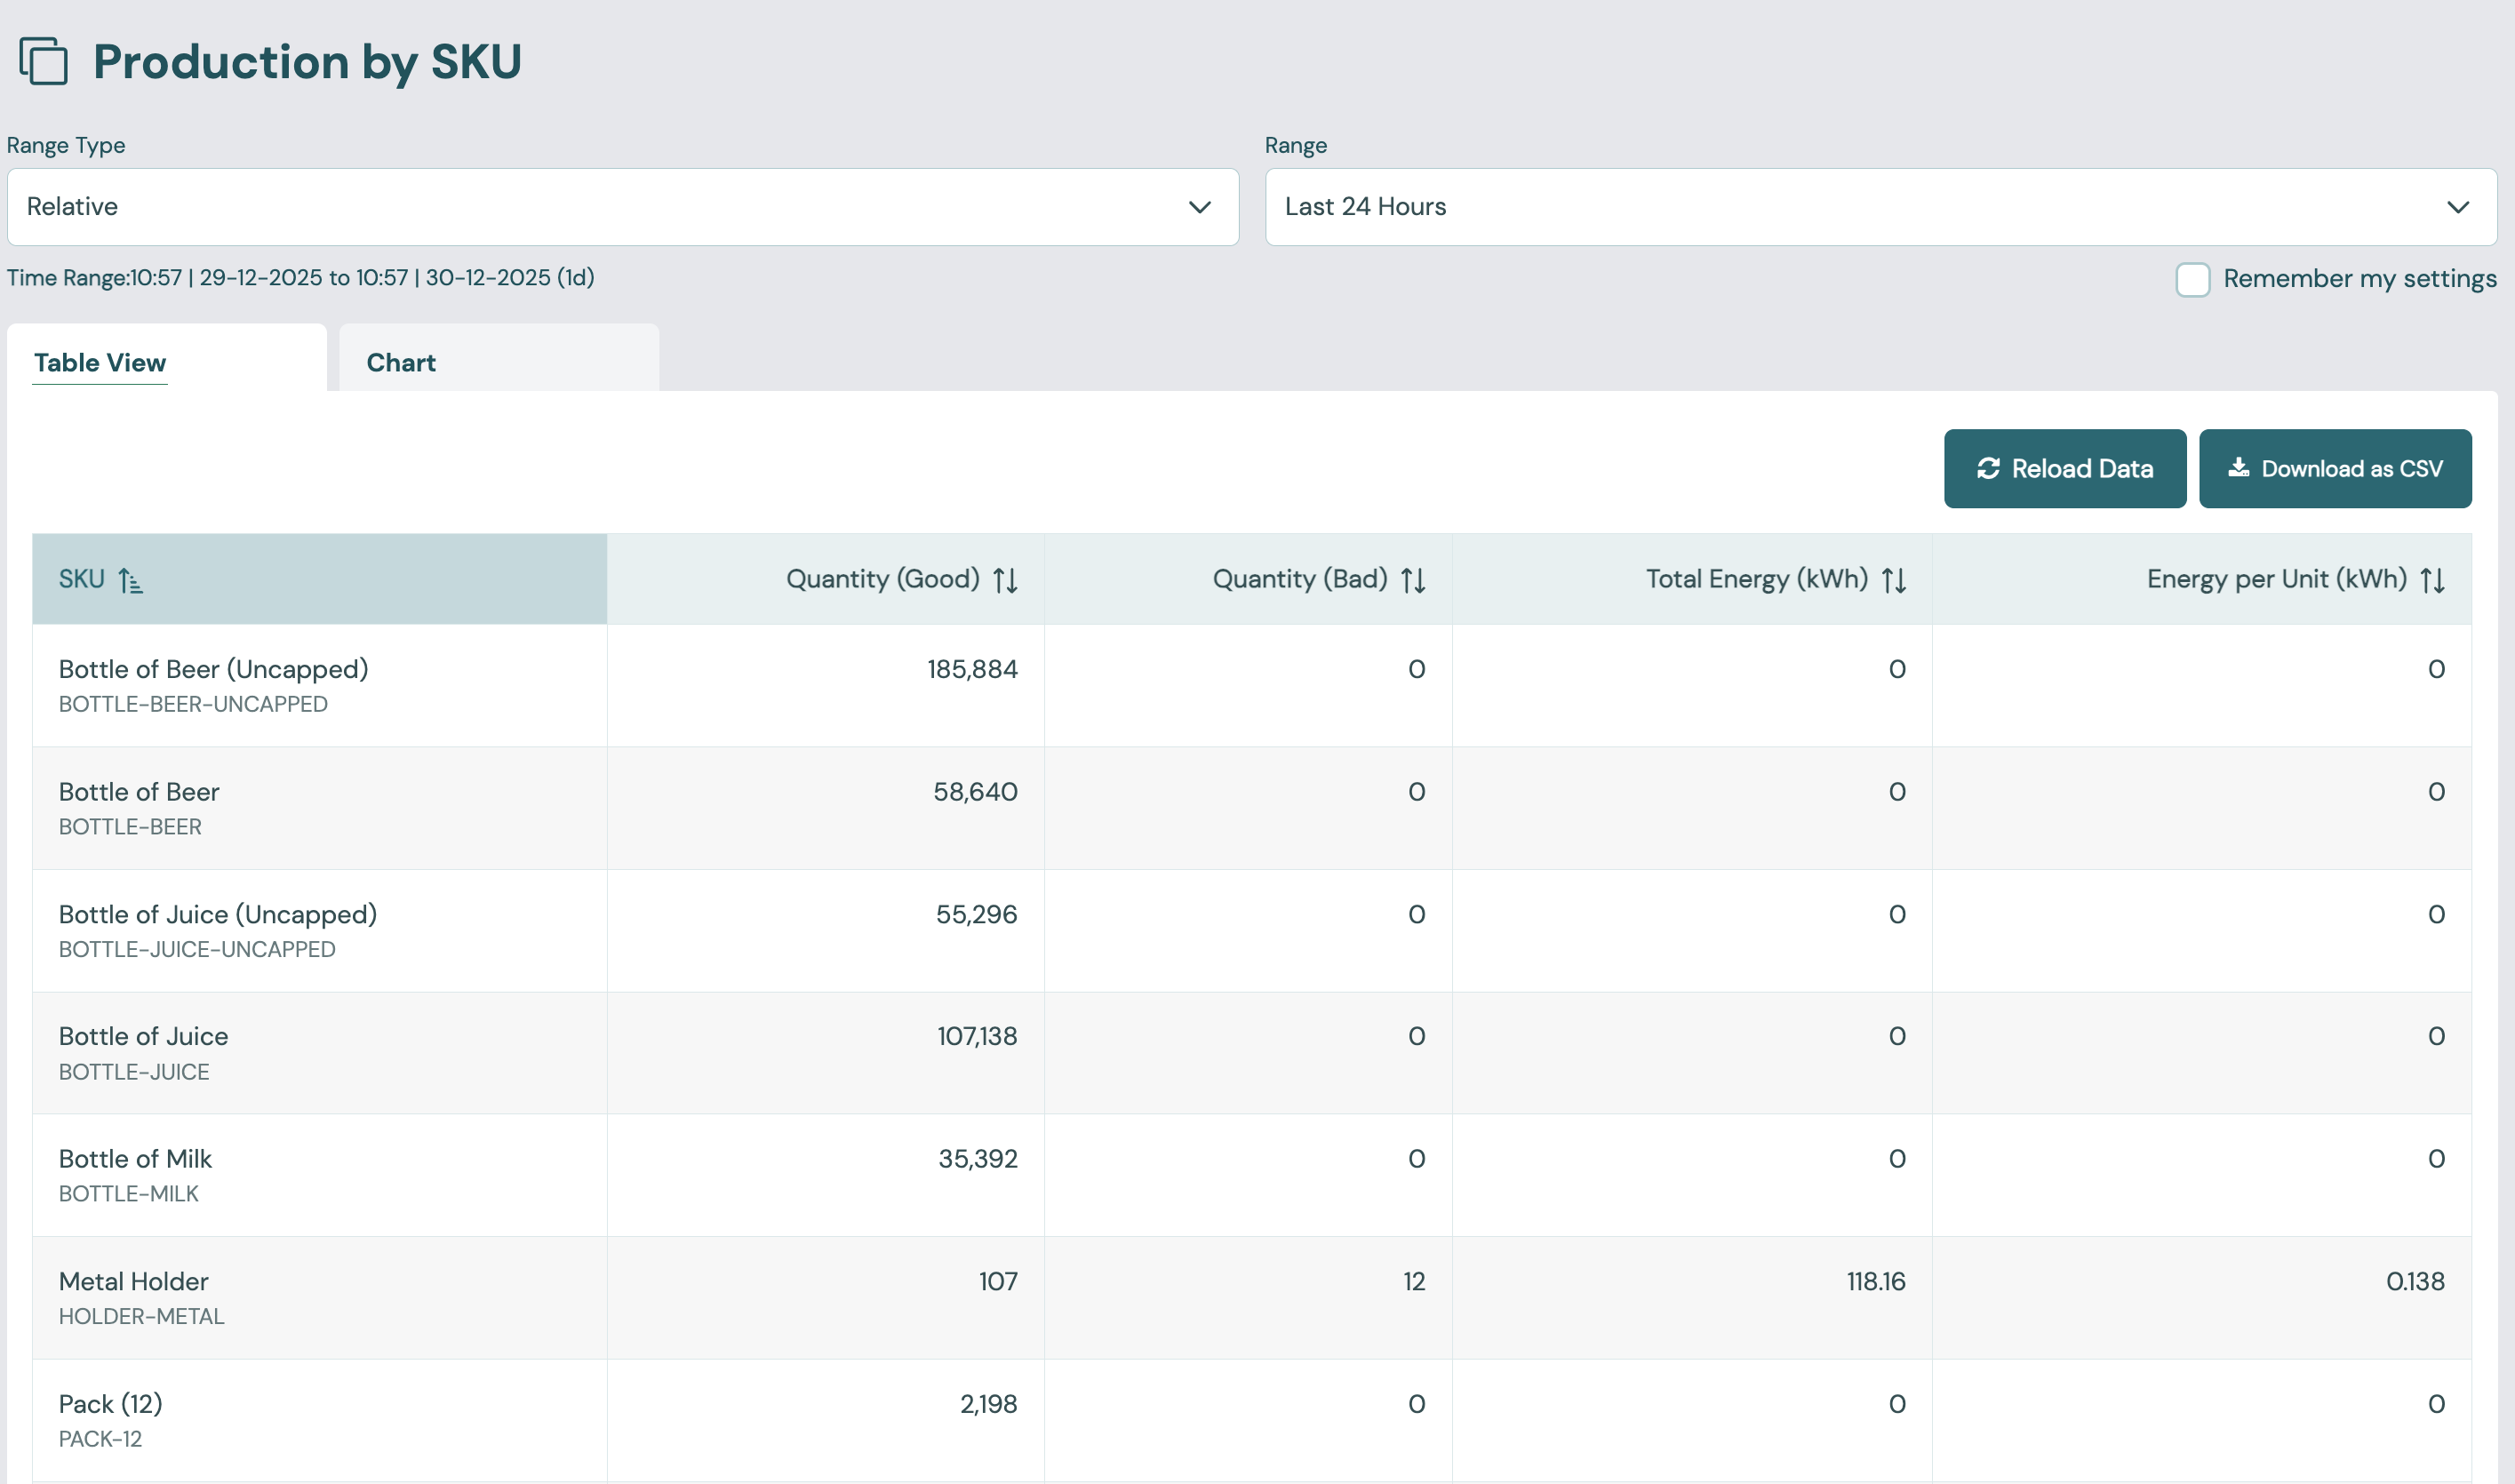
This report shows the volume of each SKU produced, with Quantity (Good), Quantity (Bad), Total Energy (kWh) and Energy per Unit (kWh). You can filter by station and choose the same ranges as by Station. The Chart tab shows the same data as a bar chart.
Production Entries
Open Production > Entries.
Production Entries lists every production entry Busroot recorded, one row per entry. You can find entries in three ways:
- Use Filters: choose the stations, SKU and range (day, week, month or relative).
- Search: switch to Search and type a work order reference. Busroot shows matching entries across all dates for the current plant.
- From a schedule: on the Schedules List, open the menu of a running or completed production schedule and select View Production. The page shows the schedule's details above its entries. Select Clear to go back to the filters.
The table has two views. Choose one above the table:
| Column | Default view | Bad Quality view |
|---|---|---|
| Time | When the entry was recorded | Same |
| Station | Station name and code | Same |
| SKU | SKU name and code | Same |
| WO Ref | The work order reference | Same |
| Quantity (Good) | Good units in the entry | Same |
| Quantity (Bad) | Bad units in the entry | Same |
| Type | How the entry was made (see below) | Not shown |
| Bad Reason | Not shown | The quality reason for the bad units. "Unknown" if none was given. A reason code that is not configured is shown as the code. |
The Type column shows:
- From Signal: counted from a machine signal.
- manual: entered by hand, in the Operator Interface or through the API.
- correction: a correction to a count, for example on the Operator Interface correction screen or on a finished schedule.
- from-speed: calculated from a speed signal.
A totals row at the top shows the number of unique stations, SKUs and work order references, and the total good and bad quantities. The table is paged, and you can reload it.
The CSV download covers every entry that matches, not only the current page. It always includes the bad reason, whichever view you choose.
For bad production grouped by reason, see Quality Analysis.