Week 19 | 2026
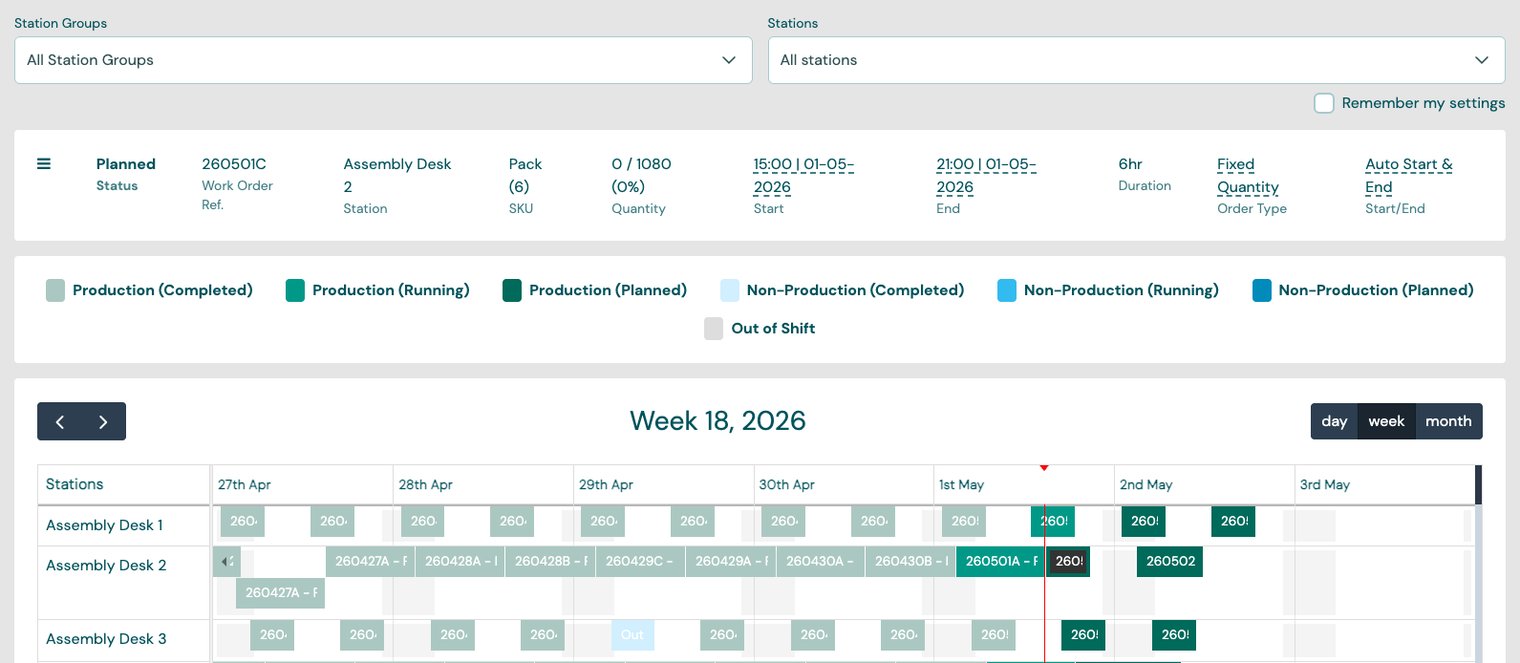
Featured Improvements — Gantt Chart
- Drag and drop between stations — controlled by an account-level feature flag.
- Station filtering — filter the Gantt view by station and station group.
- Station grouping — stations sorted by group with clear definition between groups.
- Improved Ranges — Day, Week & Month views updated for easier distribution of schedules when dragging. Week now shows 7 days without scrolling.
- Shift overlay — shift patterns displayed on the timeline; schedules spanning outside shift hours bridge to the next working period.
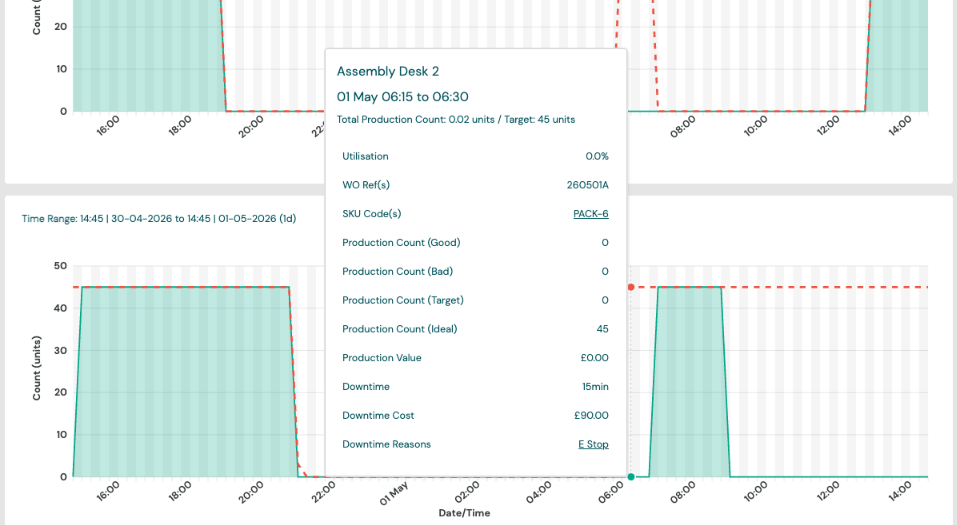
General Improvements
- Expanded metric tooltips — hover information on all metrics in Pulse and Trend charts.
- Cockpit — unreported downtime indicator — shown above station notes for each station.
- Cockpit — refreshed layout — by station, with station group accordions collapsed by default.
Bug Fixes
- Gantt chart — running fixed-quantity schedule bars now extend past their ideal end time to reflect actual progress.
- Gantt chart — improved hover-over speed and smoother dragging of short-duration schedules.
- Gantt chart — day start hour alignment corrected.
- Gantt chart — fixed double pop-up when deleting a schedule.
- Gantt chart — day alignment issues resolved.
- Schedule quantities now supported up to 10 million.
- Cockpit — progress bar correctly displays ∞ for continuous schedules.
- Trend viewer — fill rendering fixed.
- Trend viewer — utilisation target now based on scheduled production only.
- Trend viewer — relative time ranges no longer show a trailing incomplete bucket.
- ISO week calculation now uses start time.