Downtime List & Analysis
The Downtime List shows every stoppage with its station, SKU, times and reason. Downtime Analysis groups the same stoppages by reason, so you can see which causes cost you the most time, output, money and energy.
Both pages are in the Downtime menu.
Downtime List
Open Downtime > List.
- Choose the Station Groups and Stations.
- Choose the Range Type (day, week, month, quarter, relative or custom) and the Range.
- Select Submit.
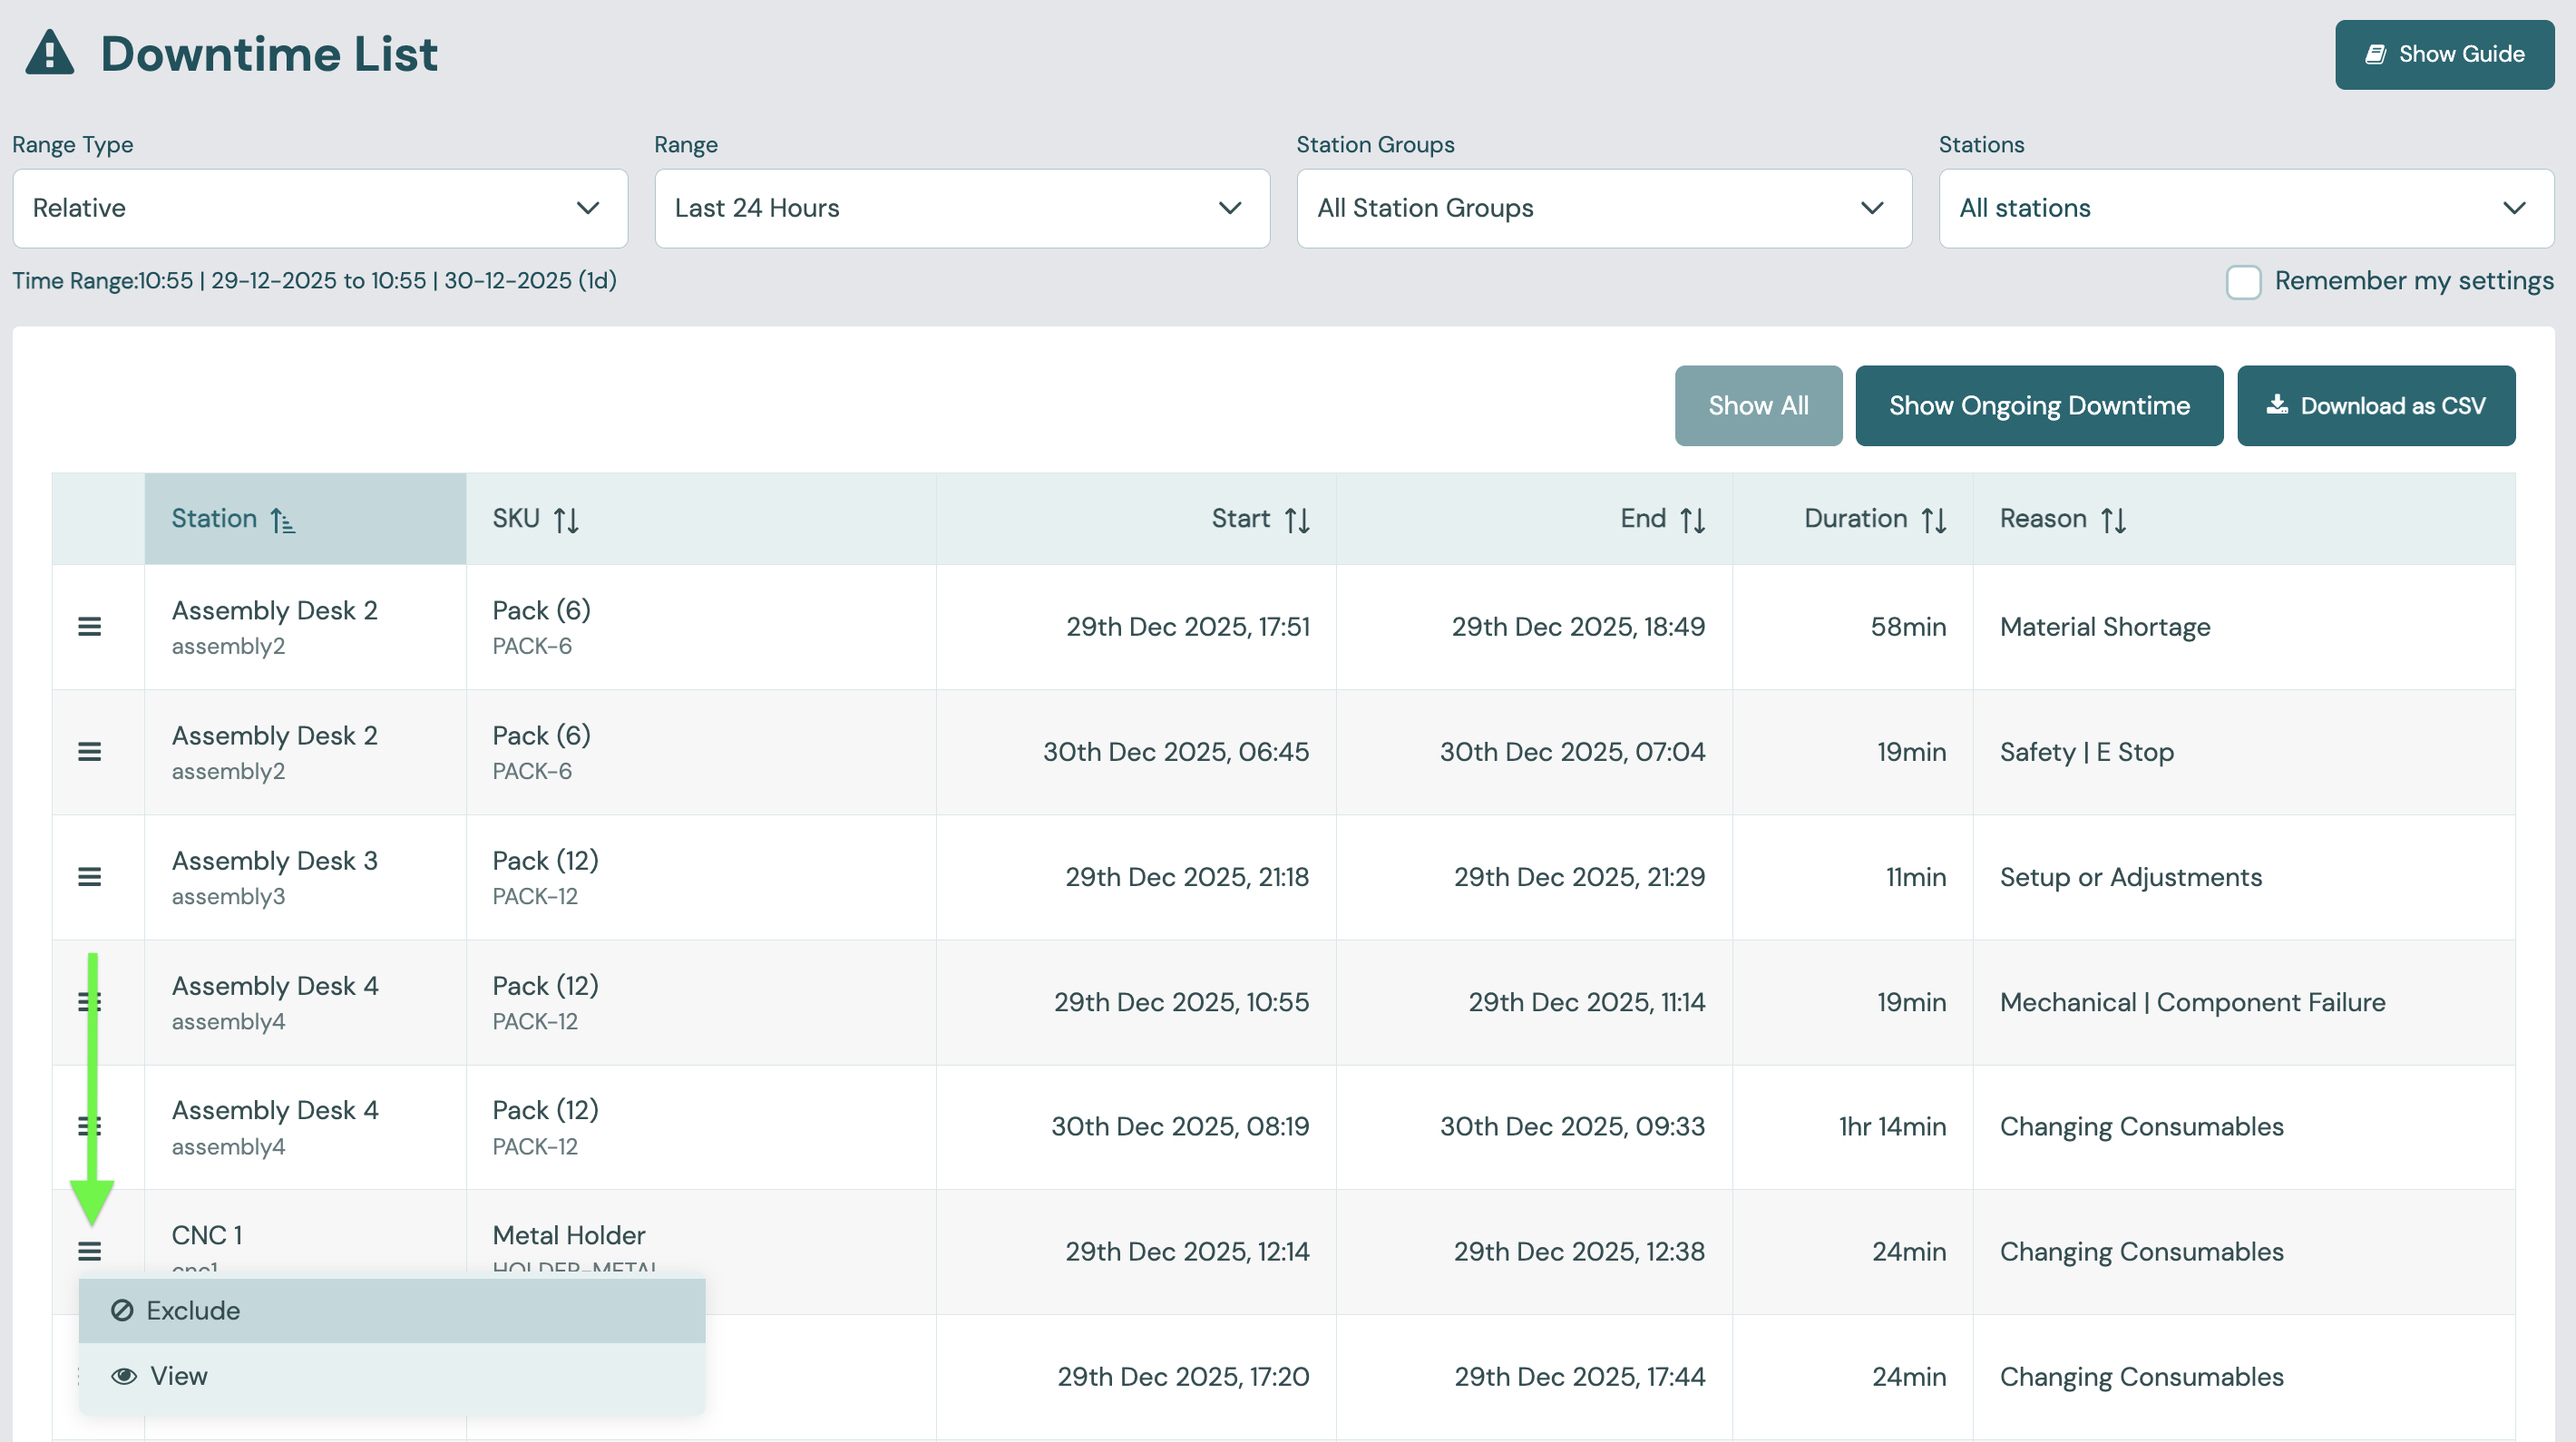
The list shows one row for each stoppage:
| Column | What it shows |
|---|---|
| Station | The station that stopped. |
| SKU | The SKU in production when the stoppage started. |
| Work Order Ref. | The work order reference of the running schedule. |
| Start, End, Duration | When the stoppage started and ended, and how long it lasted. |
| Type | Automatic (detected by Busroot) or Manual (started by an operator). Shown only when manual downtime is allowed on at least one station. |
| Reason | The reason and its parent reasons. A reason that has since been deleted is shown as its code followed by "(Deleted)". |
| Notes | The note entered with the reason, if any. |
A Total row is pinned at the top of the table. It shows the combined duration of every stoppage listed.
Use Show Ongoing Downtime to list only stoppages that have not ended yet, and Show All to list them all again. The Total row follows this choice.
Downloading the list
You can download the list as CSV. The CSV has more columns than the screen: station name and code, start and end as separate date and time columns, the duration in minutes, SKU name and code, and each level of the reason in its own column (Cause (L1) to Cause (L5)). The Total row is the last row of the CSV.
Actions on a stoppage
Open the menu on a row to:
- View: open the downtime detail page (below), where you can give or change the reason.
- Exclude: leave the stoppage out of OEE figures. Busroot asks you to confirm first.
Manual (operator-started) stoppages are listed like any other. They can also be started and ended through the API. See API and SDK.
Downtime detail
The detail page shows one stoppage: the station, how long ago it started, its start and end (or "Ongoing"), its reason ("Unknown" if none has been given) and any note. The page refreshes every 30 seconds.
To give or change the reason:
- Under Please select a reason for this downtime, select a reason. Reasons with sub-reasons open as folders, and Back returns to the level above. Only the reasons available to that station are listed.
- If the reason requires notes, enter a note. You cannot submit the reason without it.
- Select Submit.
The note is shown with the reason in the Downtime List and in the CSV. Which reasons require notes is set in Reasons.
Downtime Analysis
Open Downtime > Analysis.
- Choose the Station Groups and Stations. You can also limit the analysis to one Shift.
- Choose the Range Type and the Range.
- Select Submit.
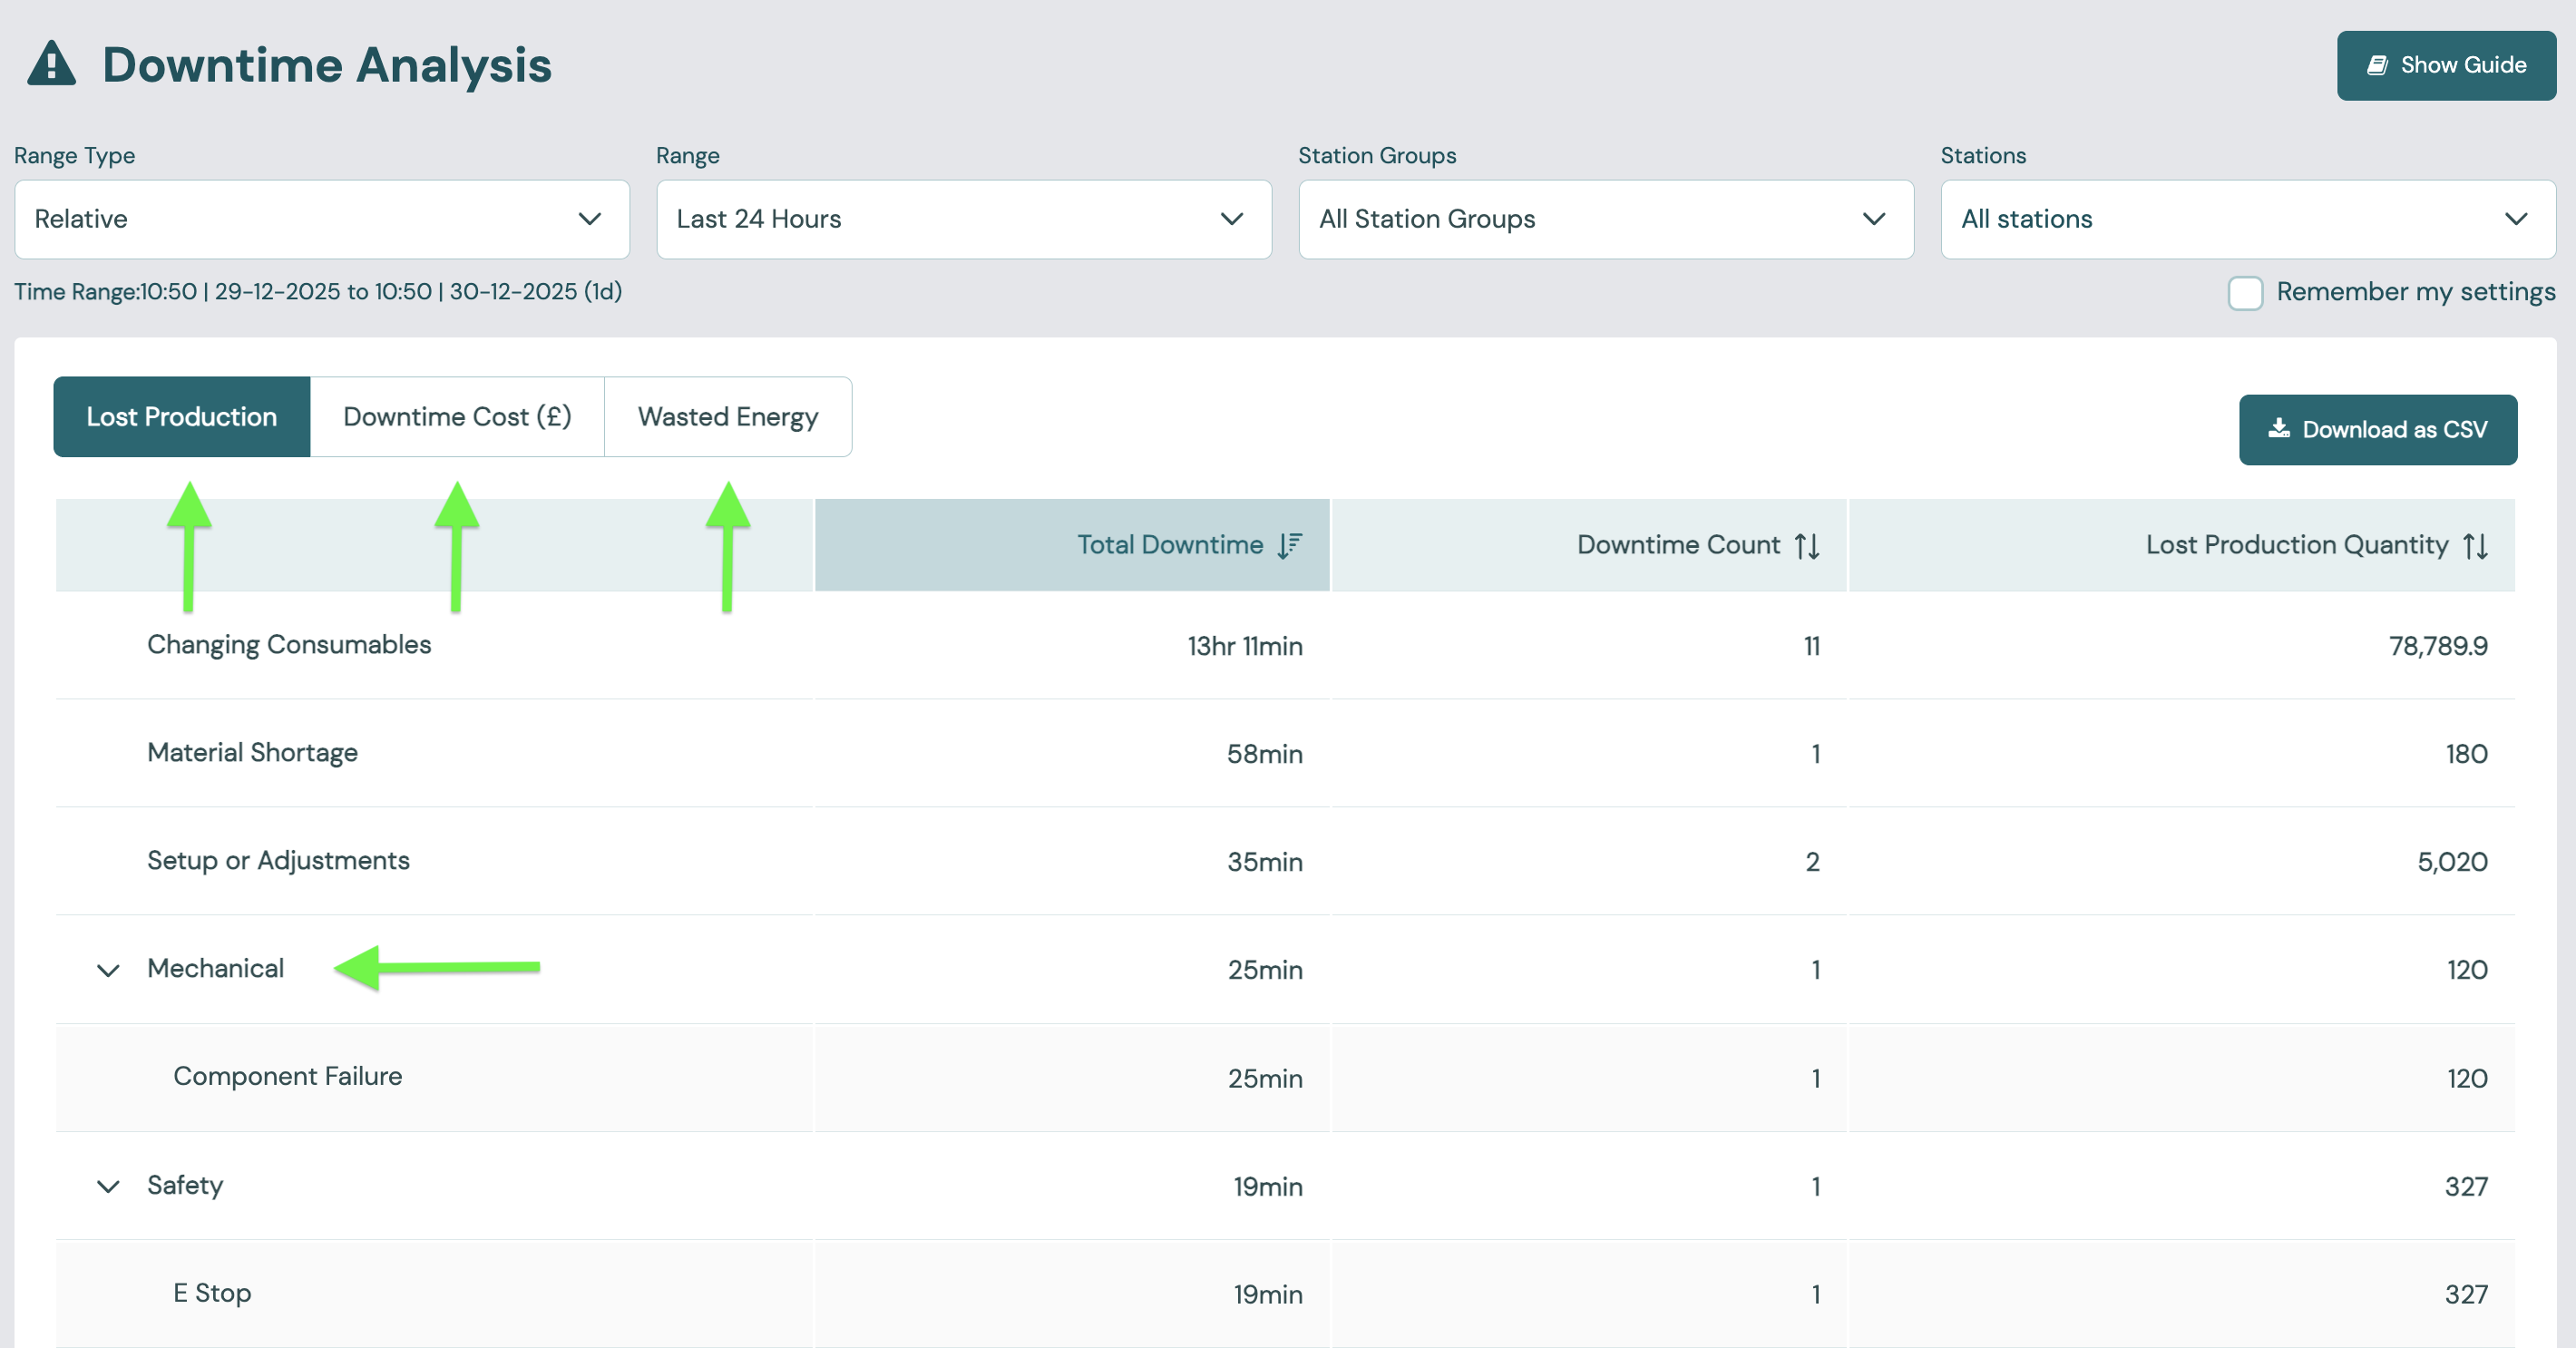
Stoppages are grouped by parent reason. Expand a parent to see the reasons under it. Downtime with no reason is grouped as Unknown. A reason code that is no longer configured keeps its own row, labelled with the code.
Every row shows:
- Total Downtime: Total downtime for the reason. See also Downtime by reason.
- Downtime Count: the number of stoppages, see Stops.
Use the buttons above the table to add a group of value columns:
| Button | Columns | What they show |
|---|---|---|
| Lost Production | Lost Production Quantity | The units you could have made in that time, at the SKU's cycle time. |
| Downtime Cost (£) | Downtime Cost | Downtime cost for the reason. |
| Wasted Energy | Energy (kWh), Energy Cost (£) | The energy used during the downtime events for the reason, and its cost. This is not the same as the Wasted energy metric. |
Click a column heading to sort by it. The bars show the sorted column. You can download the table as CSV.
Before you start
- Downtime detection and its thresholds are set for each station and SKU. See Station, SKU and Downtime › Connect.
- The downtime cost uses the cost values in Station and SKU admin.
- Reasons are managed in Reasons.
Capabilities and metrics
- Downtime: Total downtime, Downtime by reason, Stops, Downtime cost.
- Energy Efficiency: energy used during downtime, measured by the same meters as Energy consumed.