Power BI & Grafana
Busroot gives you direct access to its processed data in a data warehouse, so you can build your own reports in Power BI, Grafana or another BI tool. The data warehouse is Amazon Redshift, and data is copied to it from Busroot in real time. You have access to live and historical data with no limit on how often you query or how much you read.
What data is available
The data warehouse holds the station windows table: one record for each station for each minute, with its production, downtime, schedule and energy figures.
Connection details
An Admin can find the connection details on the Account page, in the Data Warehouse Access section:
- Database type
- Host
- Port
- Database
- Username
- Password
The section appears only when data warehouse access is set up for your account. If you don't see it, contact support.
Warning
Keep the password secret. Anyone who has it can read all your Busroot data.
Power BI
Use Power BI's Amazon Redshift connector.
- In Power BI Desktop, select Get data, then Amazon Redshift.
- In Server, enter the host and port from the Account page, separated by a colon, for example
host:port. - In Database, enter the database name.
- When asked to sign in, choose database authentication and enter the username and password.
- Select the station windows table and load or transform the data.
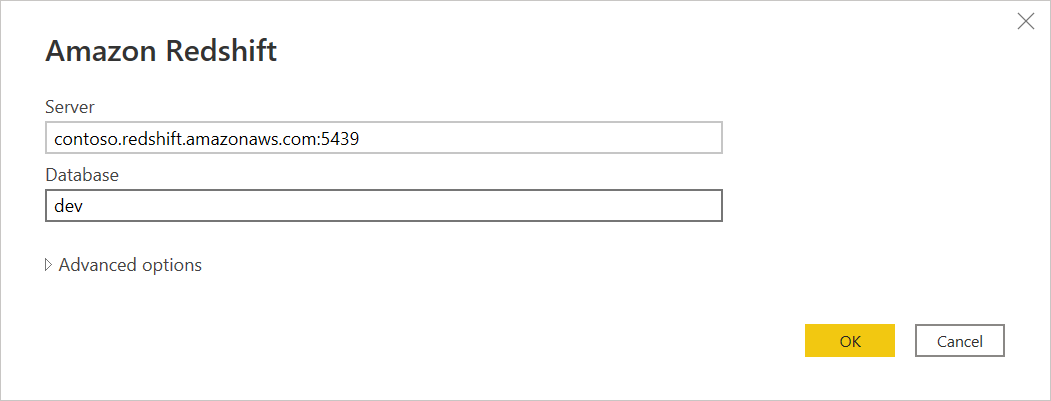
Microsoft's guide to the connector: https://learn.microsoft.com/en-us/power-query/connectors/amazon-redshift
Grafana
Add a data source in Grafana that connects to the data warehouse with the host, port, database, username and password from the Account page. Grafana's Amazon Redshift data source plugin is at https://grafana.com/grafana/plugins/grafana-redshift-datasource/.
Capabilities and metrics
The station windows table holds the underlying data for every capability. You can rebuild any metric in your BI tool, but use the definitions on the capability pages so your figures match Busroot, for example OEE, Downtime and Energy Efficiency.