Hierarchy Explorer
The Hierarchy Explorer shows time, production, stop and energy figures in one table, rolled up from station to station group to plant. Use it to compare figures side by side across your plant structure, and to check that stations and groups roll up as you expect.
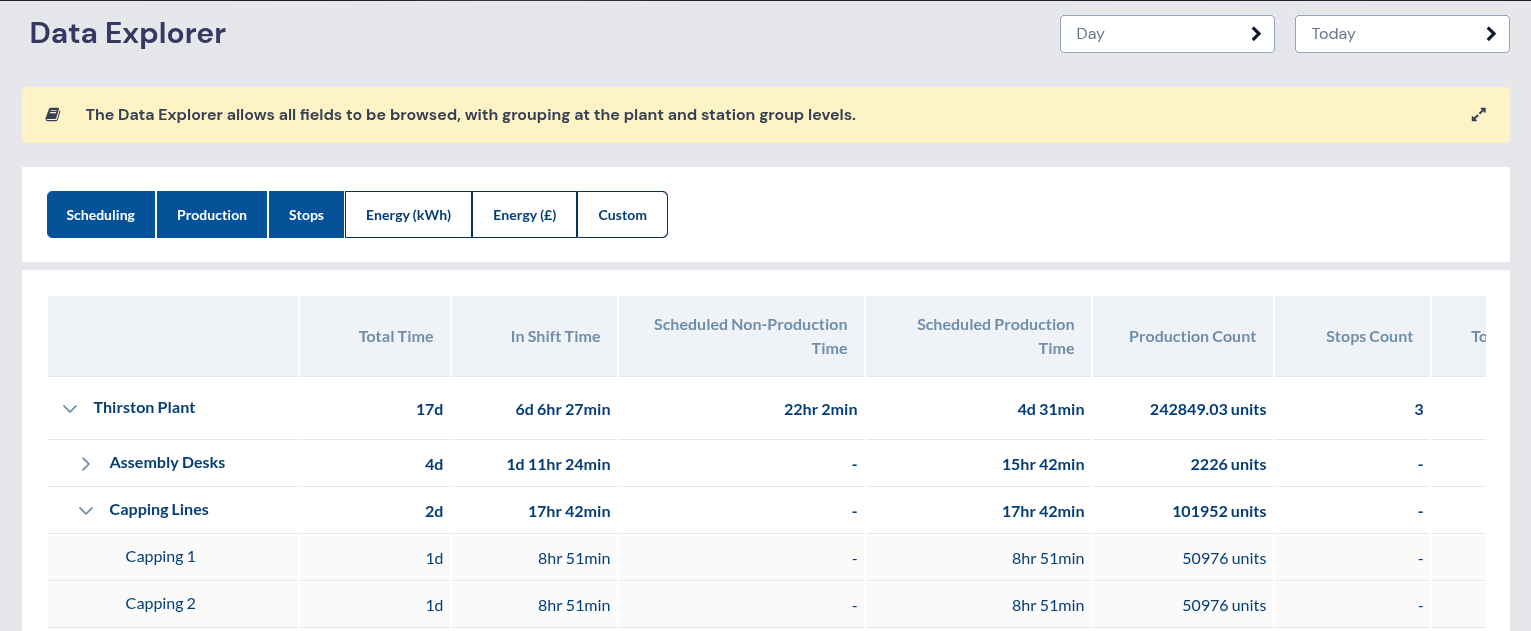
Using the Hierarchy Explorer
Open Analysis Toolkit > Hierarchy Explorer.
- Choose the Range Type (day, week, month, quarter, relative or custom) and the Range.
- Choose which column group to show: OEE, Utilisation, Scheduling, Production, Downtime, Energy (kWh) or Energy (£). Choose Custom to pick any combination of columns.
- Expand a plant or station group to see the rows under it.
Hover over a column heading to see a short description. You can export the table as CSV.
In the Total Energy column, the chart icon opens the Trend Viewer with Energy Consumed for that station or group over the same range.
The Hierarchy Explorer is a read-only report. You create and edit plants, station groups and stations in Admin: see Plant, Station group and Station.
How figures roll up
Group and plant rows add up the figures of the stations under them. Correct grouping in Admin is what makes plant-level figures correct.
Energy is the exception. When a plant or station group has a designated total energy station (a plant or line meter), that level's energy comes from the meter, not from the sum of its members. So a plant total can be different from the sum of the group rows under it.
Columns
Each column name links to the metric it shows. Some columns appear in more than one group. Total Time and Good Production Qty are in no group: choose Custom to show them.
| Group | Column | Metric |
|---|---|---|
| OEE | Total Downtime | Total downtime |
| OEE | Actual Production Qty | Production count |
| OEE | Bad Production Qty | Bad count |
| Utilisation | Total Considered Time | In-shift time minus scheduled non-production time: the denominator of Utilisation |
| Utilisation | Productive Time | Productive time |
| Utilisation | Utilisation | Utilisation |
| Scheduling | In Shift Time | In-shift time |
| Scheduling | Scheduled Non-Production Time | Scheduled non-production time, also shown as a percentage of shift time |
| Scheduling | Scheduled Production Time | Scheduled production time, also shown as a percentage of shift time |
| Scheduling | Total Scheduled Time | Scheduled production time plus scheduled non-production time, also shown as a percentage of shift time |
| Production | Target Production Qty | Target count |
| Production | Actual Production Qty | Production count |
| Production | Bad Production Qty | Bad count |
| Downtime | Stops Count | Stops |
| Downtime | Total Downtime | Total downtime |
| Downtime | MTBF | MTBF |
| Downtime | MTTR | MTTR |
| Downtime | Downtime Cost | Downtime cost |
| Energy (kWh) | Total Energy | Energy consumed (kWh) |
| Energy (kWh) | Energy / Production Hour | Energy per production hour (kWh/h) |
| Energy (kWh) | Energy / Unit | Energy per unit (kWh/unit) |
| Energy (£) | Total Energy (£) | Energy consumed (£) |
| Energy (£) | Energy (£) / Production Hour | Energy per production hour, in £ |
| Energy (£) | Energy (£) / Unit | Energy per unit, in £ |
| Custom only | Total Time | The whole length of the selected range |
| Custom only | Good Production Qty | Good count |
Capabilities and metrics
The Hierarchy Explorer serves Asset Utilisation, Scheduling, Production Tracking, Quality, Downtime, OEE and Energy Efficiency. The table above links each column to its metric.