Week 28 | 2026
This release introduces three new features: Schedule Capacity planning, Manual Downtime logging, and Reason Trends analysis. It also brings enhancements to the Trend Viewer, Pulse Chart, and Operator Tablet.
New Features
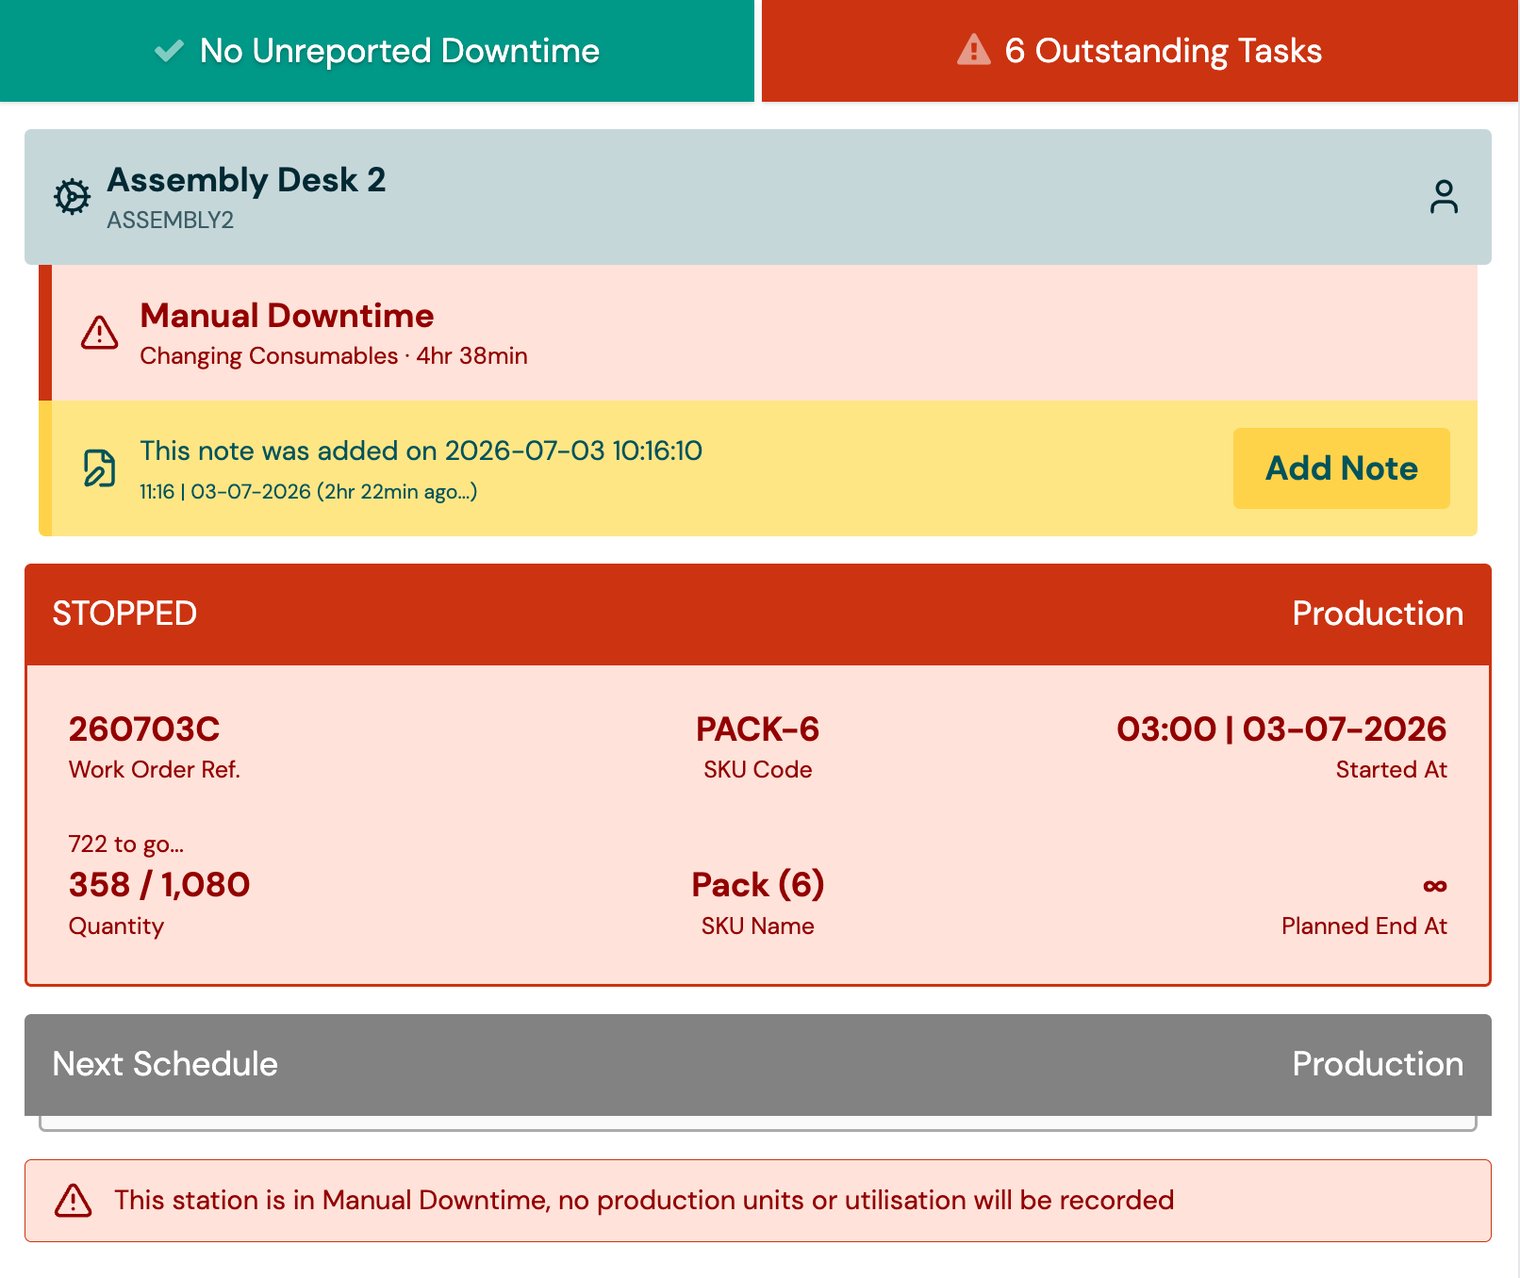
- Manual Downtime — Operators can log downtime manually from the tablet, with a mandatory reason. Useful where downtime is determined by an operator rather than an automatic signal, or where a machine is running but under investigation. While active, all production and utilisation recording is blocked. Rollout controlled per account via a feature flag.
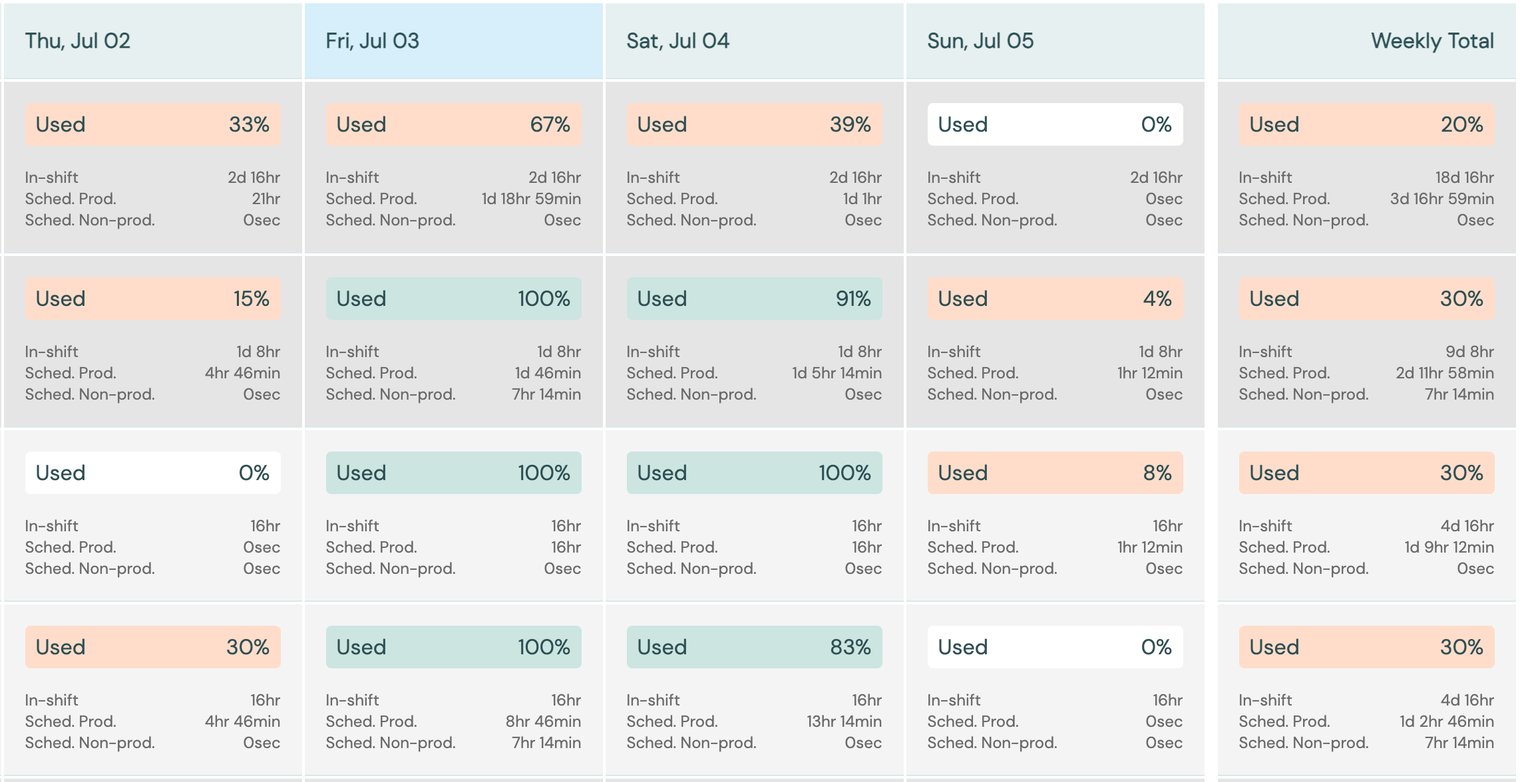
- Schedule Capacity — New page showing whether stations are under- or over-scheduled. Weekly overview with colour-coded capacity cells and CSV export. Currently in development; may be refined based on feedback.
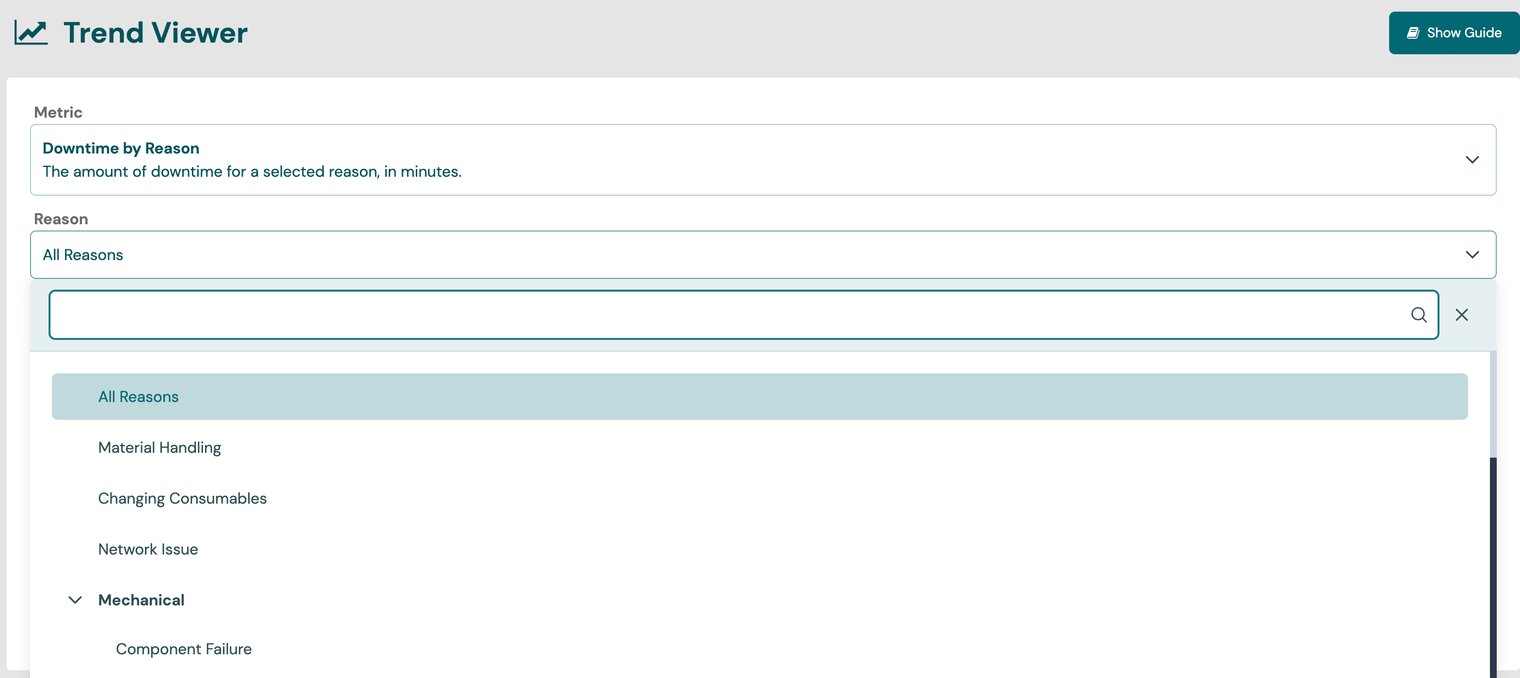
- Reason Trends — New Trend Viewer charting for Downtime and Non-Production reasons over time, with filtering by individual reason and a searchable tree-select.
Improvements
- Work Order Search — Gantt Chart and Schedule List support searching by work order reference; toggle between filter mode and search mode.
Trend Viewer
- Grouped metrics — searchable tree-select dropdown with icons on group headings.
- OEE enhancements — updated OEE metric display and axis labelling.
- Station selection limit — limited to 5 stations, with a clear message.
Pulse Chart
- Grouped metrics — tree-select dropdown consistent with the Trend Viewer.
- Sidebar guide — removed outdated reference to retrospective scheduling.
Operator Tablet
- Station list legend — colour indicators on the station list.
- Unreported downtime icon — re-instated on the tablet.
- Station details on reason screen — station info shown when providing a downtime reason.
- PPC Override for Ad-Hoc schedules — ad-hoc schedules support parts-per-cycle override.
- Header styling — standardised font sizes, spacing and border radius.
Trend Viewer & Pulse Chart
- Multi-select — close button replaced with a clearer "clear selection" action.
Production by Schedule
- Back button — returns to the Schedule List with filters preserved.
Downtime Analysis
- Percentage bars — treetable now displays percentage bars.
Station & SKU Naming
- Station Code and Name — displayed consistently across the platform.
- SKU Code and Name — displayed consistently across the platform.