Week 30 | 2026
This release introduces a new Production Entries page, improvements to the Scheduling experience, and refinements across the Trend Viewer and Operator Tablet. Several data accuracy fixes are also included.
New Features
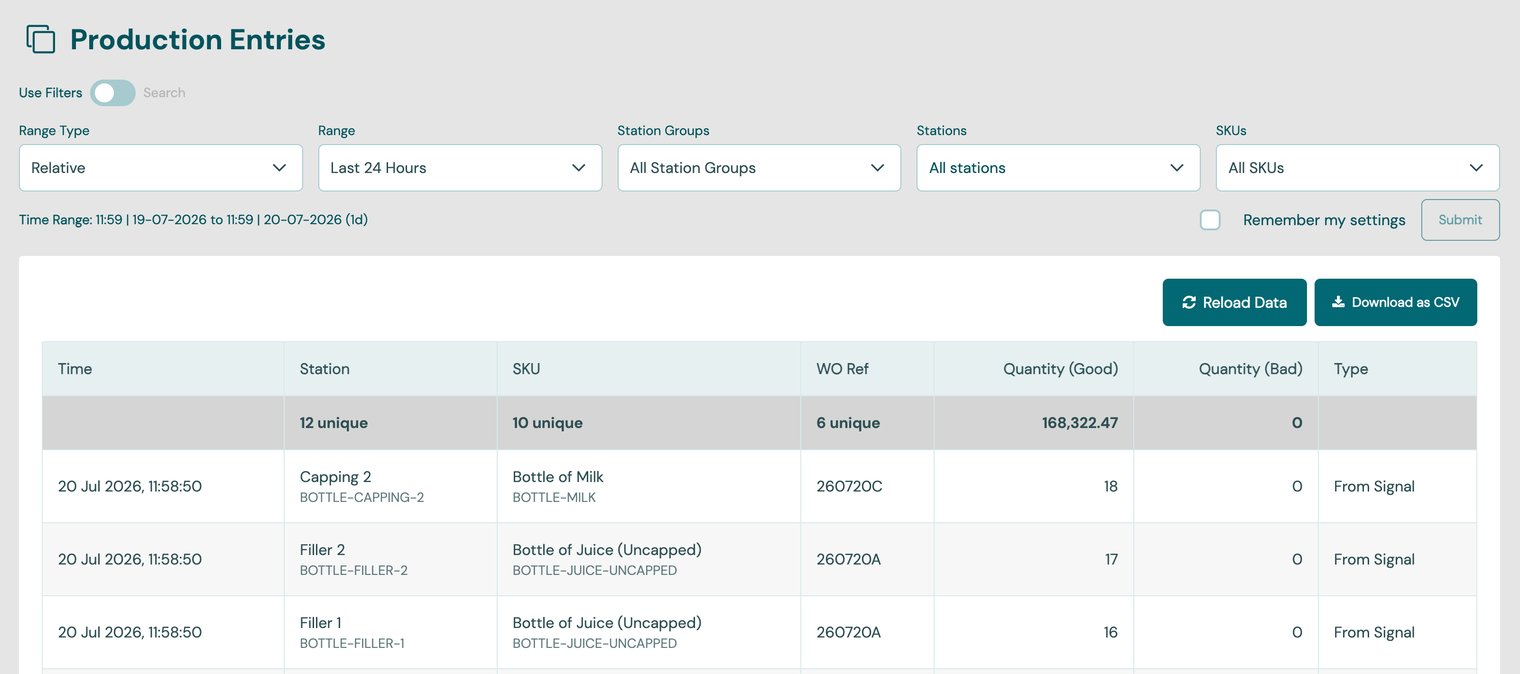
- Production Entries — New page with entry-level detail for production data, including timestamps and type for every entry. Filter by station, time range, SKU or work order reference; export to CSV. Replaces the previous per-schedule production view.
Improvements
Scheduling
- Schedule Entry page — redesigned landing page with tabs for Gantt, List and Capacity views, plus quick-access buttons to create schedules.
Schedule Capacity
- Gantt chart links — cells link directly to the corresponding Gantt view.
- Menu location — moved under the Scheduling section.
Trend Viewer
- Totals row and column added to the trend table.
- Stacked station headers for multiple stations; CSV export includes full station and metric headers.
- Full reason breadcrumb — reason names show the full parent-to-child path.
OEE Analysis
- Reasons chart — now matches Downtime Analysis chart style, including percentage bars.
Gantt Chart
- Auto-apply filters — filter changes apply immediately without an Update button.
Reason Management
- Orphaned child reasons — selectors surface child reasons whose parent was excluded. Adding a parent reason on admin forms automatically includes its children.
- Include/Exclude lists — "Move All" button moved to the top; description text clarifies each list.
Operator Tablet
- Station list — visual updates to layout and information density.
Other
- SKU code on hover — on the Overview page.
- Relative date ranges — correctly align to the plant's day start hour and week start day.
- Performance — improved load times for data-heavy views via request throttling and caching.
Bug Fixes
- Pulse Chart — disconnected stations now display purple (disconnected) rather than red (downtime).
- OEE Analysis chart clipping — fixed data cut off at chart edge.
- Page loading — pages wait for account data to fully load, preventing momentary blank content.