OEE Analysis
OEE Analysis shows OEE for the stations and range you choose, split into availability, performance and quality. It shows how much time is lost at each step and why, so you can see where improvement will give the most benefit.
Using OEE Analysis
Open Analysis Toolkit > OEE Analysis.
- Choose the Station Groups and Stations.
- Choose the Range Type (day, week, month, quarter, relative or custom) and the Range.
- Select Submit.
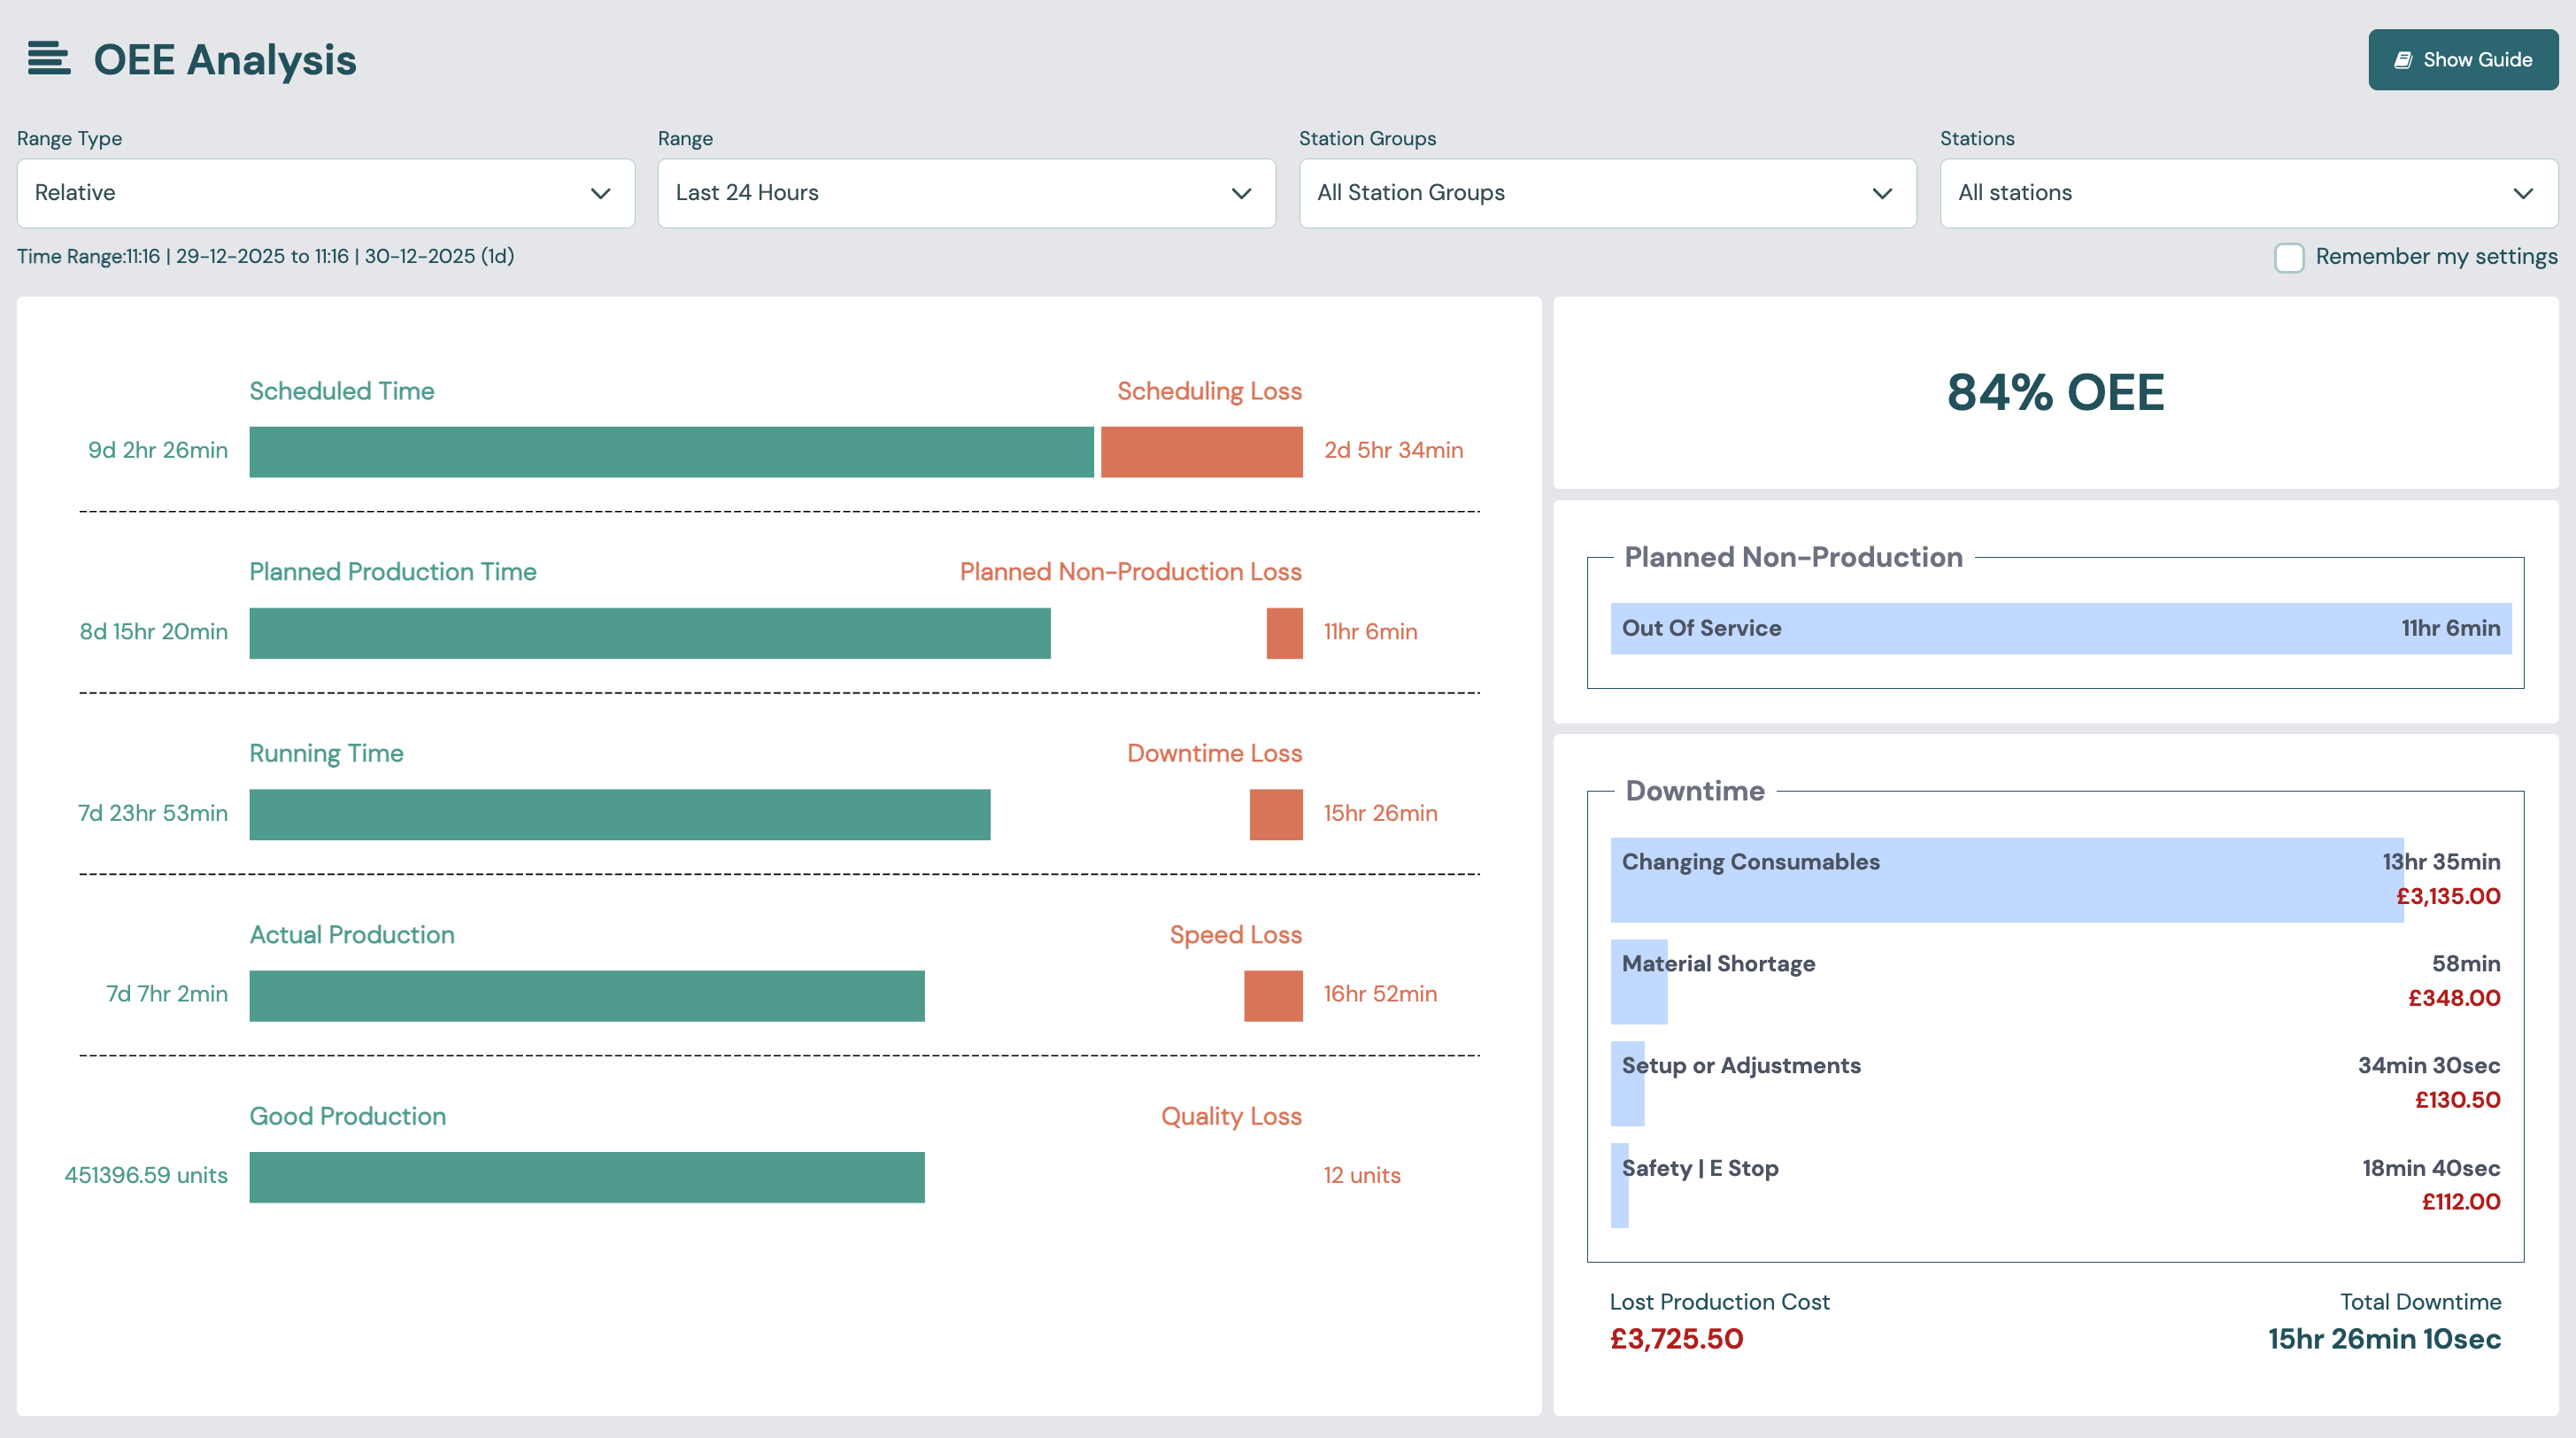
The loss chart
The chart shows how the time in the range is used, in five layers. Each layer shows what is left on the left and what was lost on the right:
| Layer | Loss | What the loss is |
|---|---|---|
| Scheduled Time | Scheduling Loss | Time when the station was available but no production schedule was assigned. |
| Planned Production Time | Planned Non-Production Loss | Scheduled non-production time, such as maintenance. |
| Running Time | Downtime Loss | Unplanned stops. This is the Availability loss. |
| Actual Production | Speed Loss | The shortfall when output is below the ideal rate. This is the Performance loss. |
| Good Production | Quality Loss | Bad units. This is the Quality rate loss. |
OEE only counts time when production is planned. Out-of-shift time and planned non-production time are not held against it.
OEE and reason panels
Next to the chart:
- OEE shows the combined OEE for the selected stations.
- Planned Non-Production shows scheduled non-production time by reason.
- Downtime shows downtime by reason, with Total downtime at the bottom. Downtime with no reason is shown as Unassigned.
Expand a reason to see its sub-reasons.
When lost production cost is turned on for your account, the Downtime panel also shows a Cost for each reason and a Lost Production Cost total. See Lost production cost. To turn it on, set Enable Lost Production Cost in Account settings.
OEE Analysis has no breakdown of bad production by reason. Use Quality Analysis for that.
Station table
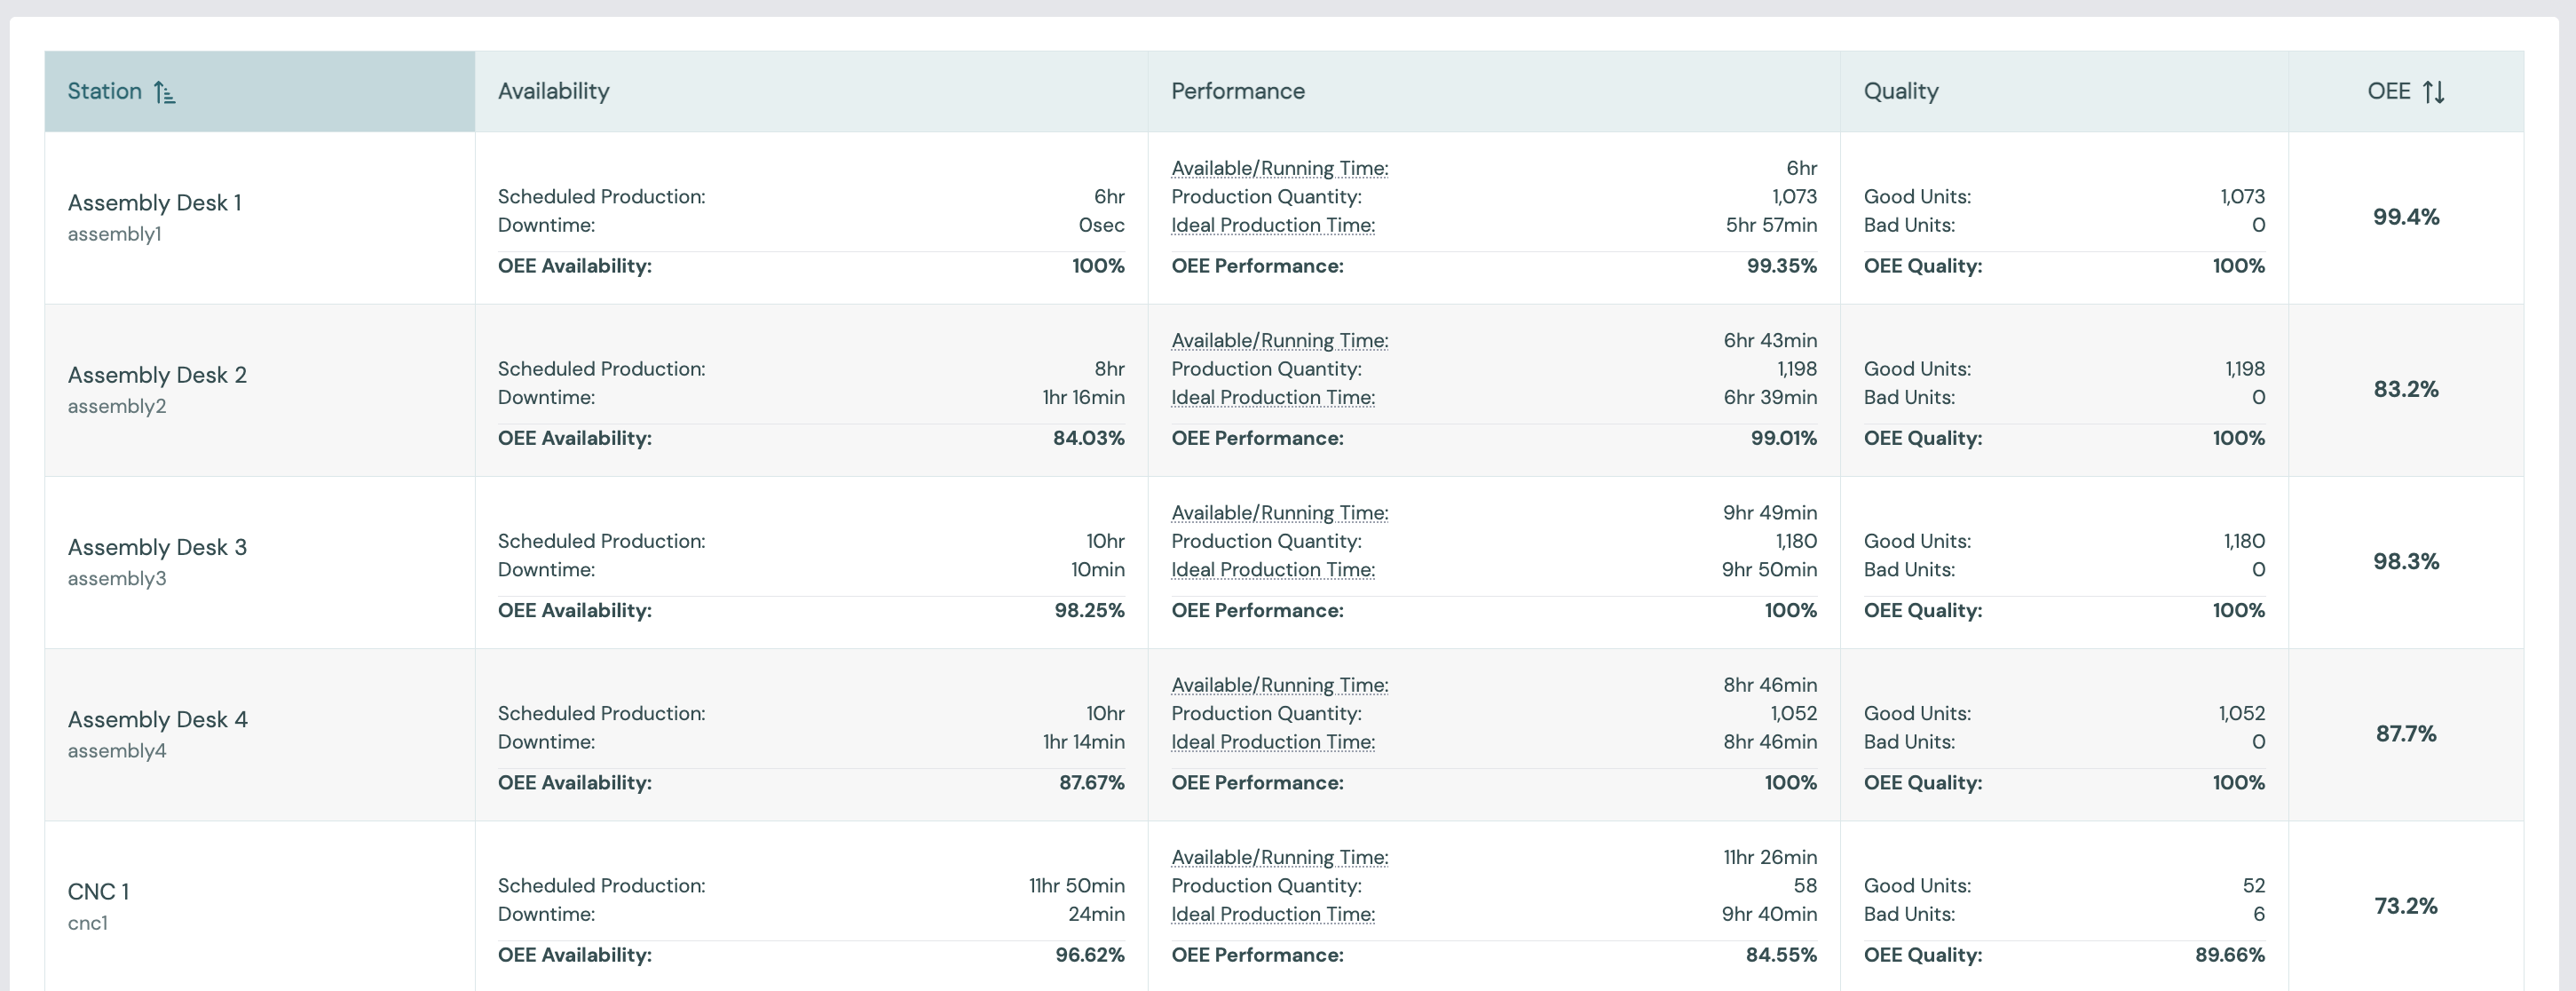
Scroll down to see Availability, Performance, Quality and OEE for each station, with a Total row at the top. You can export the table as CSV.
Before you start
OEE Analysis uses data you already have, but it is only as accurate as your setup:
- Production schedules for each station. See Gantt & Schedules.
- A performance target (cycle time) for each SKU. See SKU.
- Downtime detection and thresholds for each station. See Station.
- Downtime and non-production reasons. See Reasons.
- Good and bad counts from machines or operators.
The inputs are described in OEE › Connect.