Cockpit
The Cockpit is the live dashboard for a plant. It shows every station's current state, the schedule it is running and how far through it is, and the last hour's production and OEE, so supervisors can see problems as they happen and react.
Open it from Live Monitoring > Cockpit. The page refreshes every 30 seconds.
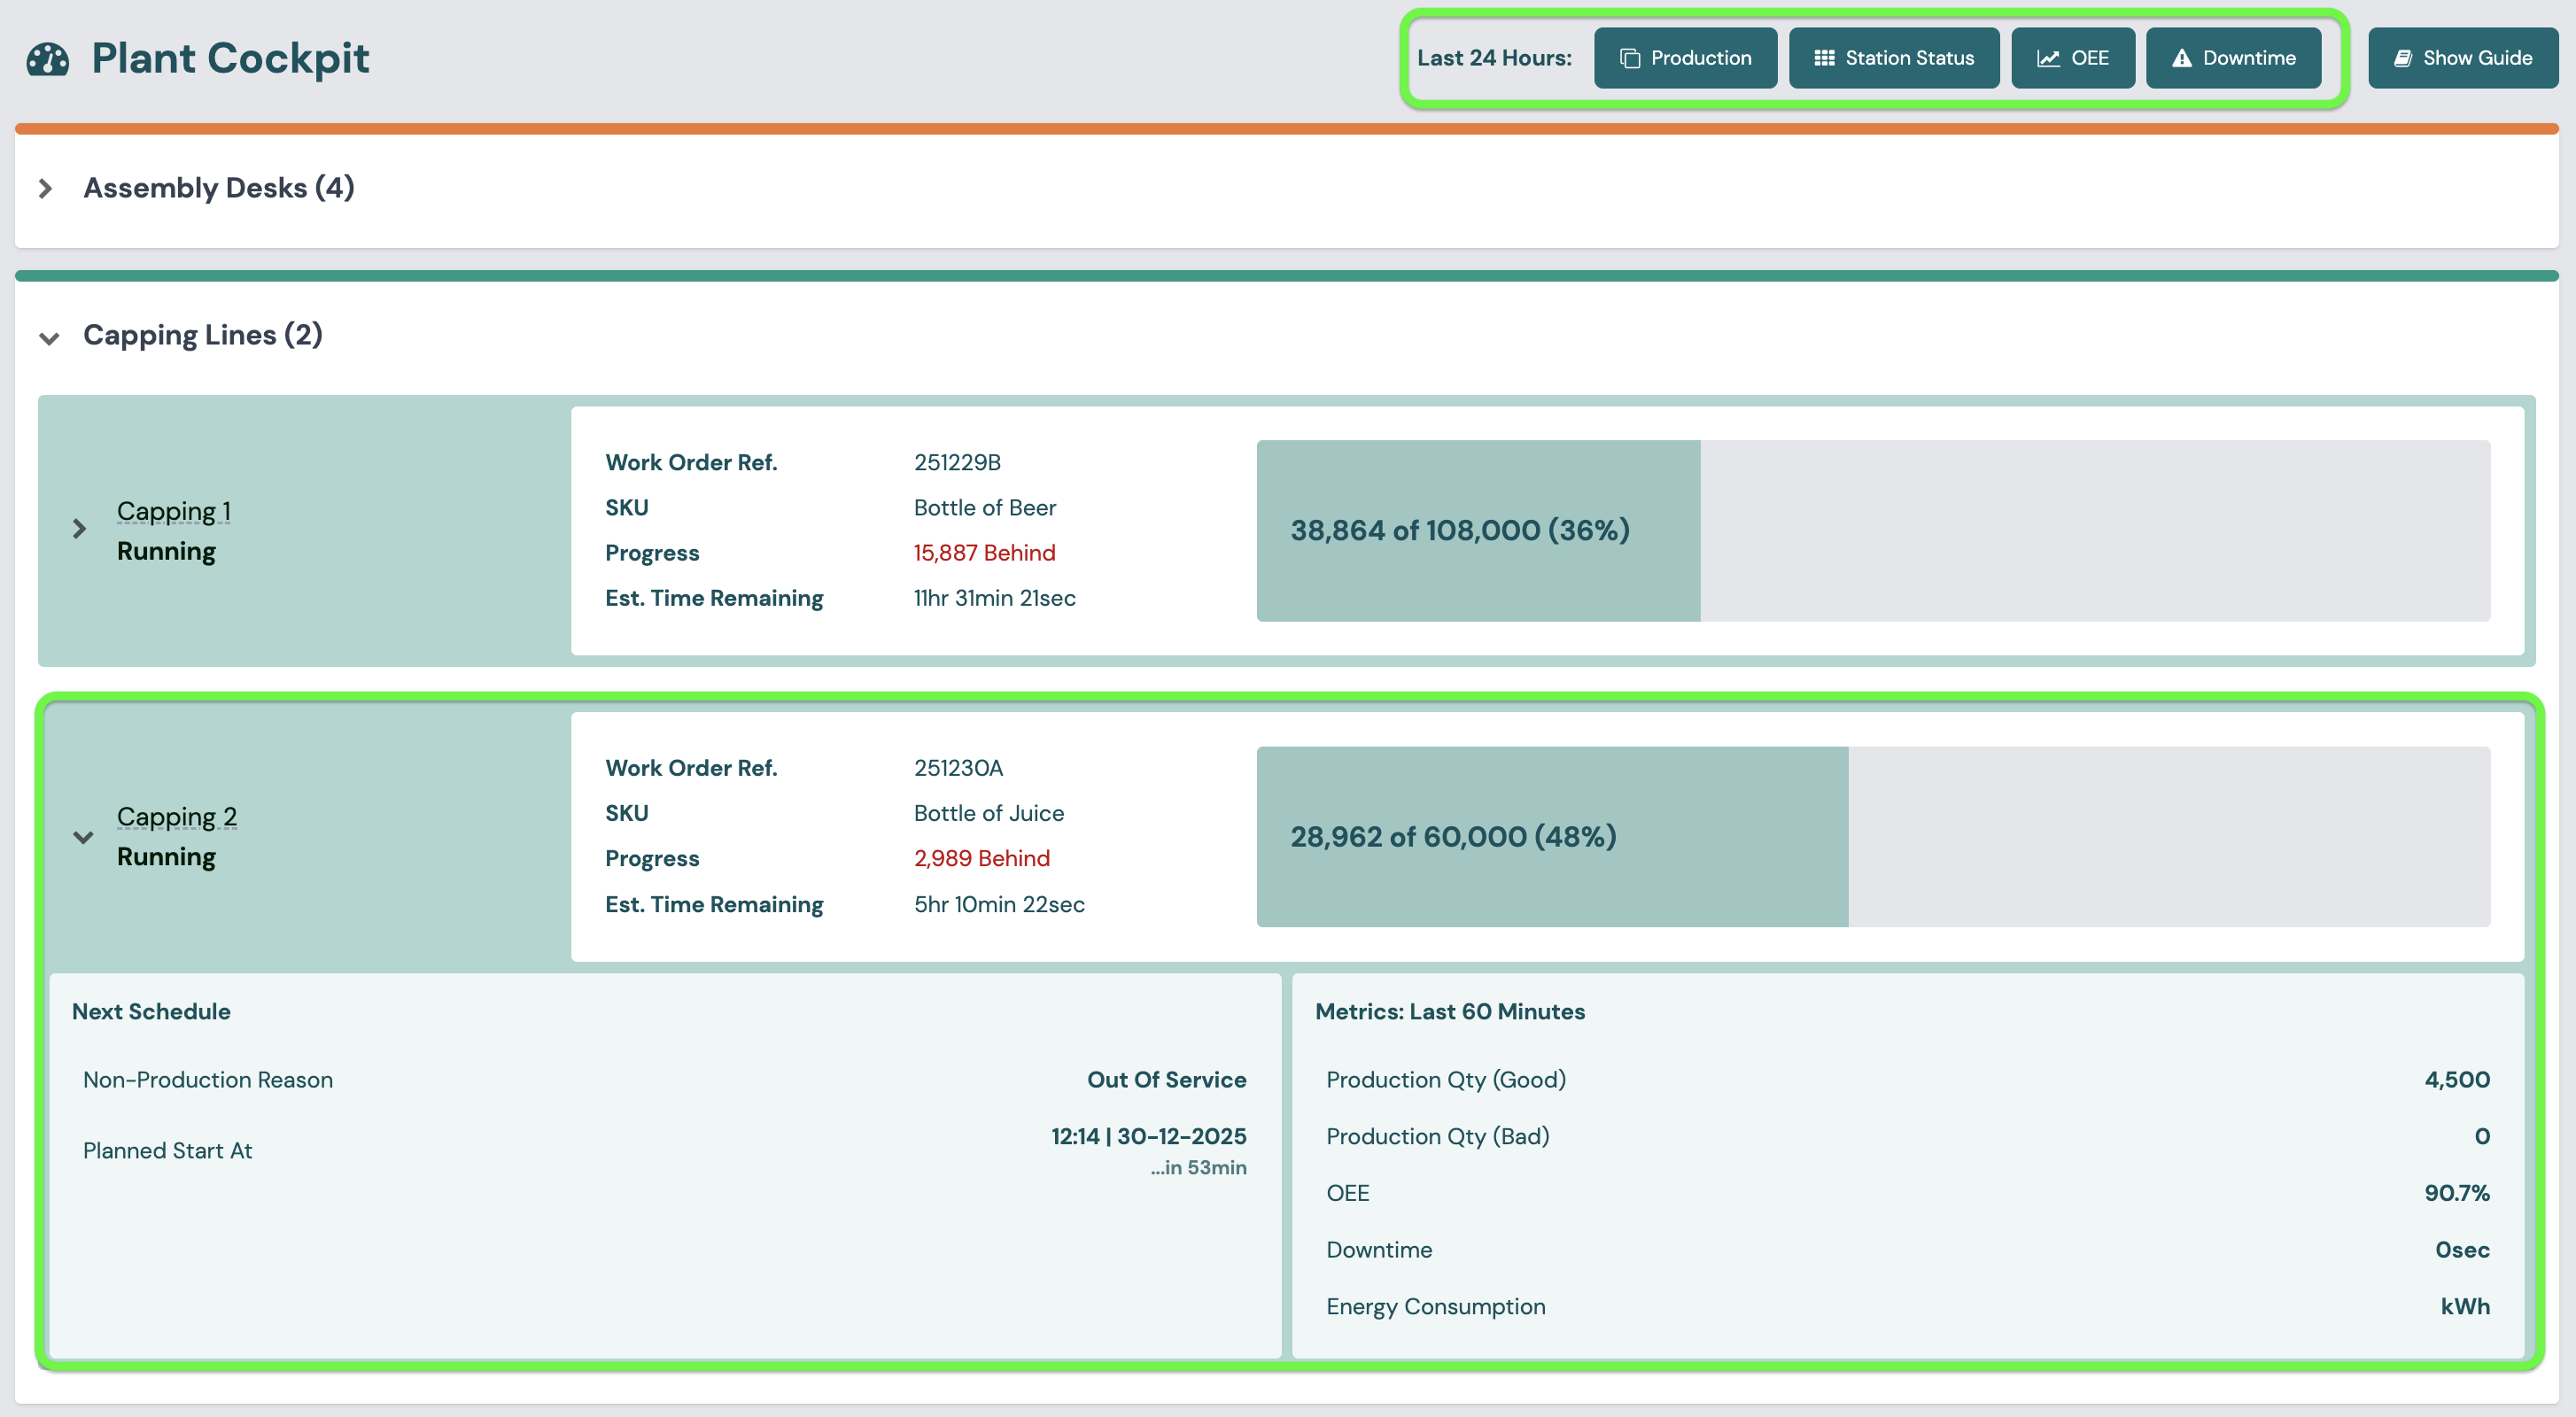
Using the Cockpit
Station groups
Choose the plant with the plant selector at the top of the page. Stations are listed under their station group. Each group is a panel that shows the group name and the number of stations in it. The panel is coloured by the most urgent state among its stations: a stopped station colours the whole group. Click a group to expand it.
Station rows
Each station row is coloured by the station's state and shows:
- Name and state, for example Running or Stopped. When a station is stopped, the row shows the downtime reason, or "Reason not assigned" if nobody has given one yet, and the time the stop began. A stop that an operator started by hand shows "Manually since".
- Operator initials, if an operator has entered them in the Operator Interface.
- Unreported downtime: a red bar with the number of stops that still need a reason, or a green "No Unreported Downtime" bar.
- Pending Tasks: where Tasks are in use, a red bar with the number of pending Tasks, or a green "All Tasks Completed" bar. Click it to open Task History for that station.
- The latest station note, if there is one. See Station notes.
Running and next schedule
To the right of each station:
- Current schedule: the Work Order Ref., the SKU and a progress bar showing units produced against the planned quantity, as a percentage. This is the schedule's schedule progress.
- Progress says whether the schedule is On Track, a number of units Ahead or a number of units Behind. It compares the units produced with the units the station should have made in the time the schedule has been running. Hover over it to see that ideal quantity.
- Est. Time Remaining is the remaining units multiplied by the cycle time per unit. Hover over it to see both figures.
- A non-production schedule shows its reason and planned end instead.
- Next Schedule: the Work Order Ref., SKU, planned quantity and planned start of the next production schedule, or the reason and planned start of the next non-production schedule.
- Last 1 Hour Metrics: OEE, good and bad production quantity (good count and bad count) and downtime over the last hour. This strip is hidden on narrow screens.
Shortcuts
Each station row has three buttons:
- Go to Operator Interface opens the Operator Interface for that station.
- Add Schedule opens the Add Schedule form with the station already selected.
- Add Note adds a station note.
At the top right of the page, the Last 24 Hours links open the last 24 hours in other tools:
| Link | Opens |
|---|---|
| Production | Production reports, by WO Ref. |
| Station Status | Pulse Chart |
| OEE | Hierarchy Explorer |
| Downtime | Downtime Analysis |
Station notes
Station notes are short messages about a station, shared between desktop users and operators. A note can be up to 250 characters.
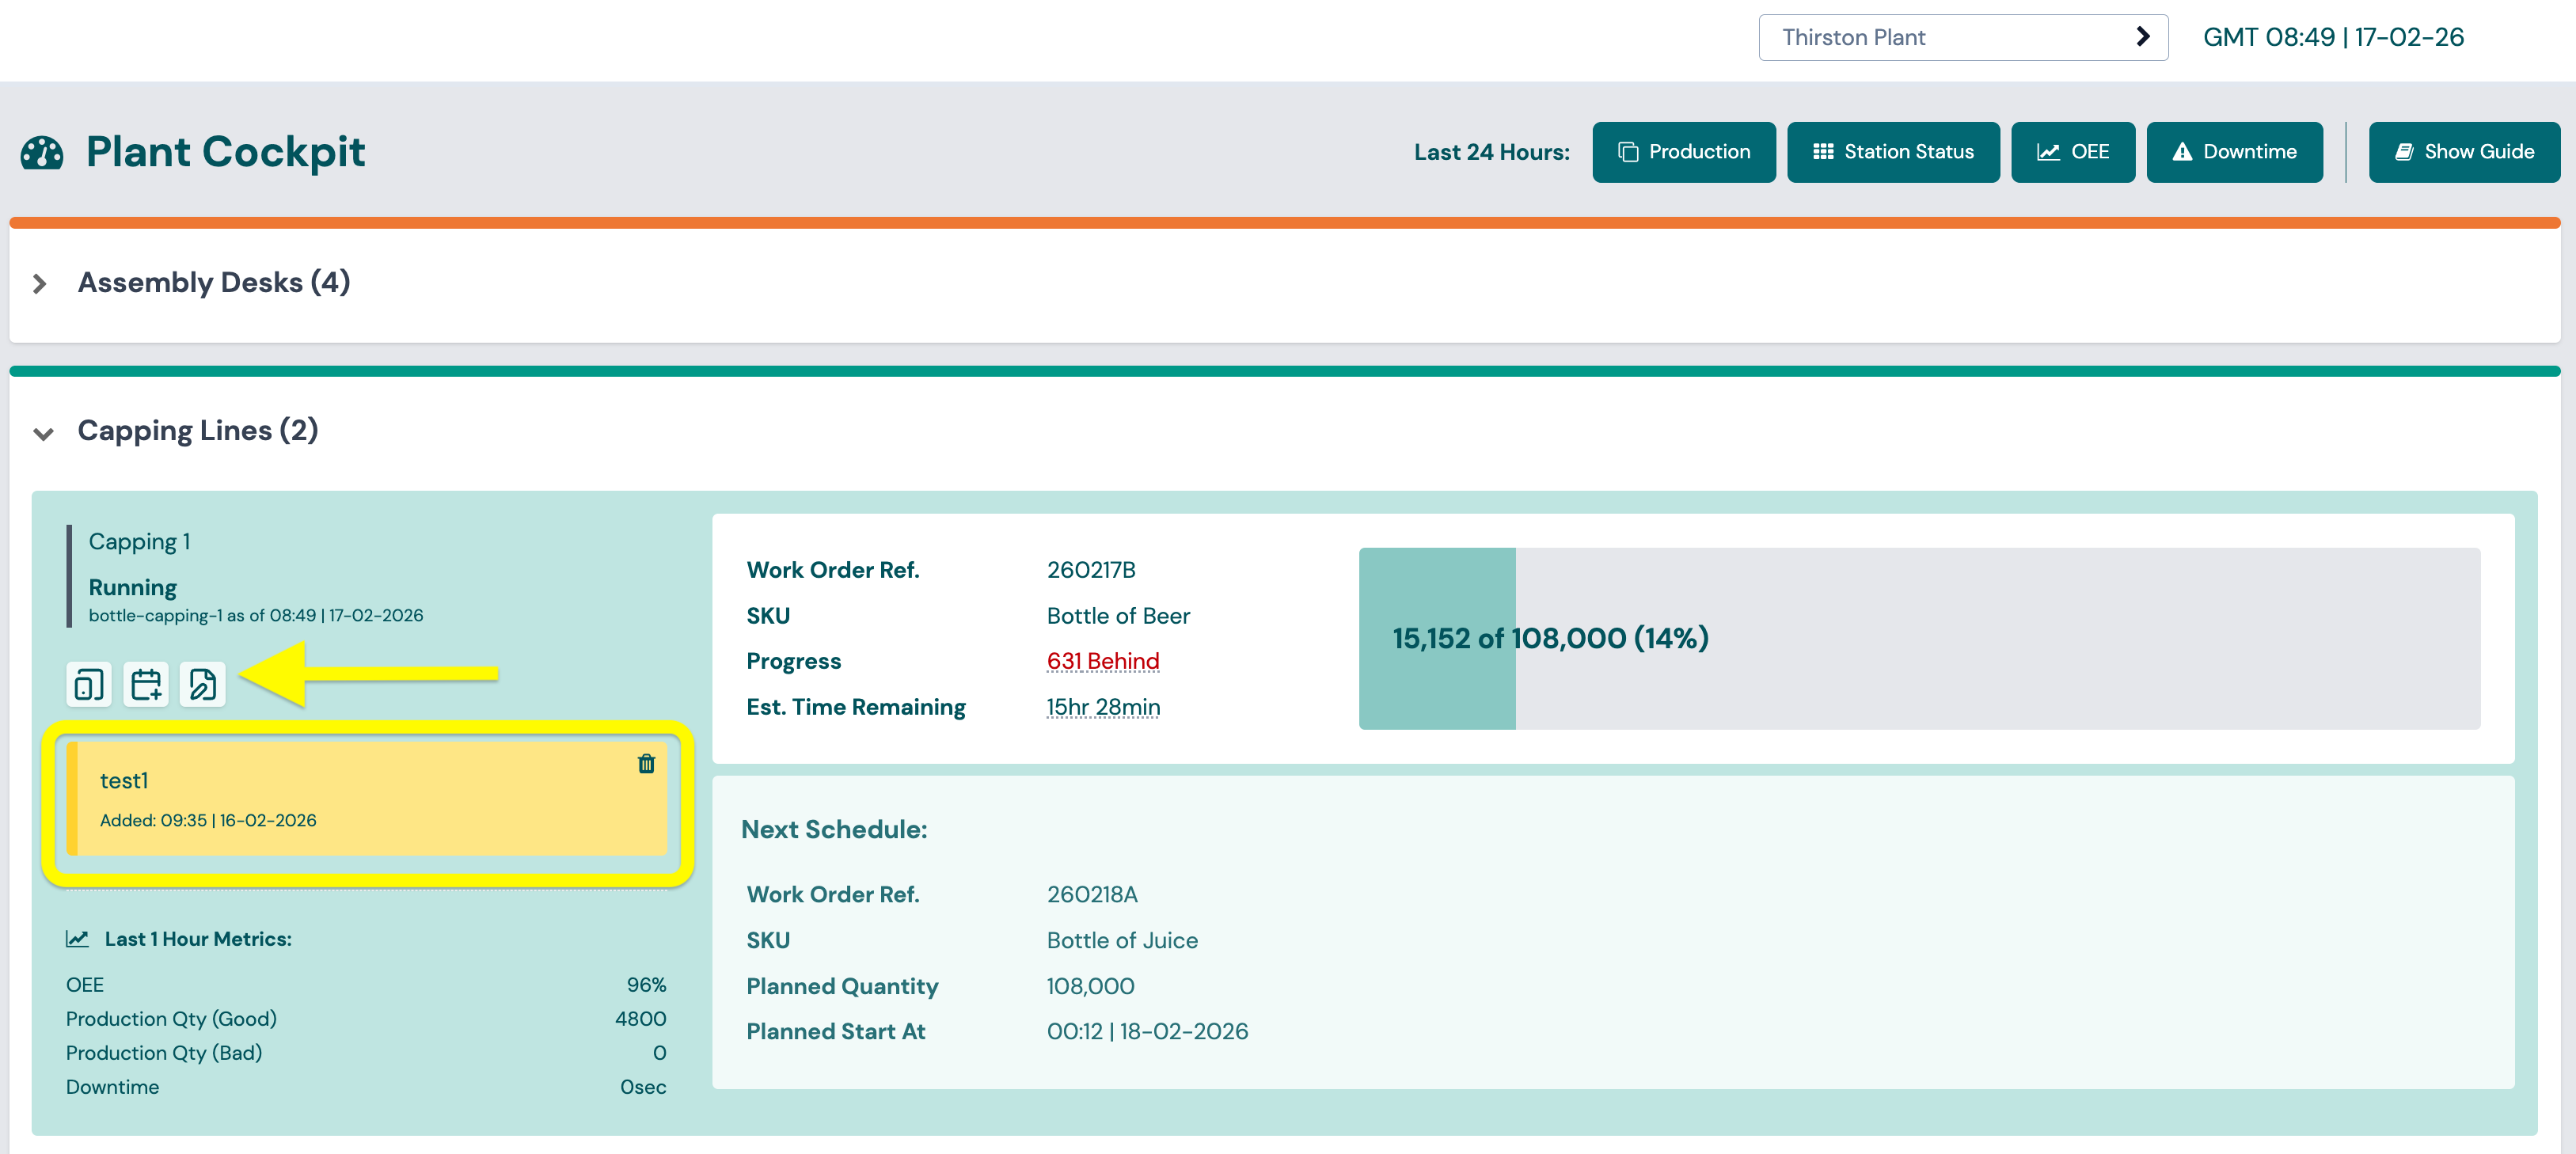
- Add a note from the Cockpit with the Add Note button on the station row. Operators add notes from the Operator Interface.
- Where notes appear: the latest note for a station shows on its Cockpit row and in the station header of the Operator Interface. Operators can open the last five notes for the station.
- Hide a note: click the eye icon on the note in the Cockpit and confirm. A hidden note is no longer shown on the Cockpit or in the Operator Interface. Read-only and Supervisor users cannot hide notes.
- Notes expire one year after they are added.
The Station Notes page
Notes > Station lists every note, newest first, with the station, the note, when it was created and who added it (the operator's initials, or the desktop user's email). Filter the list by station and time range; the default range is the last 7 days. Hidden notes stay in the list, with a white background instead of green, so you can show them again: open the row menu and choose Show or Hide. You can also download the list as a CSV file.
Setup
The Cockpit needs no setup of its own. It shows what is configured in Admin:
- Plants, station groups and stations.
- Shift patterns, for the station states.
- SKUs with a performance target, for progress and time remaining.
- Schedules, for the current and next schedule.
To show the Cockpit on a TV, see Operator screens and displays.
Capabilities and metrics
| Capability | What the Cockpit shows |
|---|---|
| Production Tracking | Schedule progress, good count for the last hour |
| Downtime | Current stop and its reason, unreported stops, total downtime for the last hour |
| OEE | OEE for the last hour |
| Quality | Bad count for the last hour |
| Scheduling | Current and next schedule |
| Tasks | Tasks pending |